SA's first data on five-year cancer survival rates released by Discovery Health (across ten-year study period)

One of the first things most people diagnosed with cancer want to understand is their estimated survival rate. Until now, there hasn't been publicly available information on this front specific to South Africa's population. We share the first localised data on five-year cancer survival rates (in Discovery Health's privately insured population), across the four most common cancer types.
Authors
Shirley Collie (Chief Healthcare Analytics Actuary) and Lizelle Steenkamp (Senior Healthcare Statistician)
Data reasonably representative of the South African privately insured population
This paper shares the process of collating our five-year cancer survival rates using data from in Discovery Health's substantial, privately insured, local population (reasonably representative of the South African privately insured population).
Why do we look at a five-year period? Globally, this is a common timeframe selected by national surveillance systems. Looking at a five-year period also enables us to compare our outcomes to those in global healthcare systems.
We consider cancer survival rates in:
- Breast cancer
- Prostate cancer
- Colon cancer
- Lung cancer
Cancer a leading cause of death worldwide
Cancer is set to become a major cause of morbidity and mortality in the coming decades, in every region of the world. Some research1 predicts an increase in the incidence of all-cancer cases from 12,7 million new cases in 2008 to 22,2 million by 2030.
And, according to the World Health Organization2:
- Cancer was a leading cause of death worldwide, accounting for nearly 10 million deaths in 2020, or nearly one in six deaths.
- Many cancers can be cured if detected early and treated effectively.
- The most common cancers are breast, lung, colon and rectum and prostate cancers.
- Around one-third of deaths from cancer are due to tobacco use, high body mass index, alcohol consumption, low fruit and vegetable intake, and lack of physical activity.
- Cancer-causing infections, such as human papillomavirus (HPV) and hepatitis, are responsible for approximately 30% of cancer cases in low- and lower-middle-income countries.
For people diagnosed with cancer, access to localised survival rate data is key
Estimated cancer survival rate data offer a truly patient-centric measure to people diagnosed with this disease. However, there has, until now, been no publicly available, up-to-date, information on cancer survival rates specific to South Africa's population.
Available, published data relates to other markets. Most available data has come out of the United States. There cancer survival rates are based on data and reports published by the National Cancer Institute's surveillance Research Program which manages the 'Surveillance, Epidemiology, and End Results' - SEER - Program.
- The SEER program is an authoritative source of information on cancer incidence and survival, collecting and publishing statistics from population-based registries, covering 34% of the US population.
- SEER registries routinely collect data on patient demographics, primary tumour site, tumour morphology, extent of disease, first course of treatment, and active follow-up for vital status. Detailed statistics on cancer incidence, mortality, survival, and prevalence are broken down according to sex, race and ethnicity, age, stage at diagnosis, and geographic area. Information on tumour morphology is also presented.
According to the American National Cancer Institute3, " The best indicator of progress against cancer is a change in age-adjusted mortality (death) rates, although other measures, such as quality of life, are also important."
South Africa has data on cancer incidence
In South Africa, we do have access to data on cancer incidence (newly diagnosed cases). It's based on a pathology registry, called the South African National Cancer Registry (NCR-SA), which is a division of National Health Laboratory Services. The NCR was established in 1986 as a voluntary reporting system to which all pathology laboratories in the country could contribute data. South Africa also has information on rates of deaths due to cancer (based on the National Department of Home Affairs' certification system). However, our research has not turned up any published literature related to South African cancer survival rates, likely due to the fact that the NCR lacks data around cancer mortality.
Issuing of regulation 380 of the National Health Act of 2003 (in 2011) made cancer a notifiable disease, obliging all laboratories to report confirmed cancer diagnoses to the NCR. This meant significant improvement in local reporting on cancer. All cancers confirmed in private and public sector laboratories since 2011 have been reported to the NCR-SA. So, it's the only current source of complete national cancer incidence data for South Africa, from which long term cancer epidemiology trends can be determined.
However, the limitations of a pathology-based surveillance system include the under-estimation of cancer, as some case definitions exclude clinically diagnosed, benign and pre-cancerous lesions. Also, data processing using ICD-O3 codes is labour-intensive causing delays in producing up-to-date cancer incidence reports.
Determining localised, five-year cancer survival rates: Our research and data
Discovery Health is South Africa's largest private health insurance administrator, providing comprehensive healthcare insurance to more than 3.7 million people, across 19 employer-based medical schemes and also the Discovery Health Medical Scheme (South Africa's largest open medical scheme i.e., open enrolment regardless of employer affiliation).
Access to data from these schemes means access to a large pool of information that allows our clinical research and actuarial teams to perform advanced disease-risk modelling in relation to various illnesses and diseases. For the purposes of this paper, access to data on claims and how members use the private health system, allows us to generate real-world insights into cancer and other conditions. Discovery Health also invests significant resources into auditing data related to medical scheme member mortality.
We combined this audited mortality data with data from Discovery Health's cancer registration system, to calculate cancer survival rates in medical scheme members over a decade.
We analysed:
- Age standardized mortality trends by primary cancer
- Five-year absolute and relative cancer survival rates of cancer patients across the top four most prevalent cancer types
- The five-year relative survival cancer rate for the paediatric population
- Person-years of life lost due to cancer and average years of life lost per person dying of cancer
Age standardized mortality trends by primary cancer
- South Africa's National Cancer Strategic Framework (NCSF) is intended to guide the development, implementation, monitoring and coordination of Cancer Policies, related Strategies and other cancer related activities.
According to data shared through South Africa's NCSF4, cancer mortality rates in women (Figure 1) have remained stable over the past 14 years (1997-2010). Mortality rates for prostate cancer, and to some extent also colorectal cancer, in men have increased - though this is thought to be due to increased rates of screening and diagnosis in the black male population in South Africa. Authors of the NCSF state that prostate cancer is known to behave more aggressively in black men than in those of other races and data show that often black men present with an advanced stage of disease.
NCSF data also show a decline in mortality rates from oesophageal and lung cancer in men, but the reasons for this aren't clear.
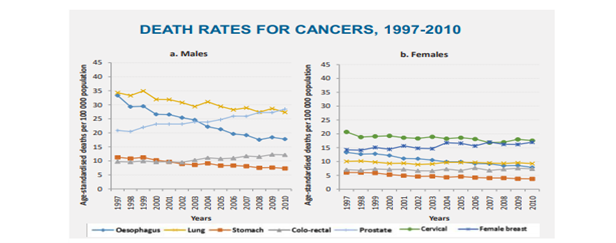
Figure 1: Top five causes of cancer mortality in South Africa 1997-2010; Source: NCSF
In the Discovery Health administered medical scheme member base:
- Between 2010 and 2019 age-standardised mortality rates of breast cancer in women and prostate cancer in men - the most common cancers in women and men - worsen with time. These trends are also evident in national statistics (Figure 1).
- Lung and colon cancers are more prevalent in men than women. In men we see increases in lung cancer deaths over time. We have recorded increases in colorectal cancer death rates in men and women (to a lesser extent in women) and these trends are consistent in both the private sector and national statistics.
- In the private sector, cervical cancer death rates in women have increased from 2010 to 2019. In the case of these cancers, a slight decrease is observed in the public sector, albeit off a much higher relative base.
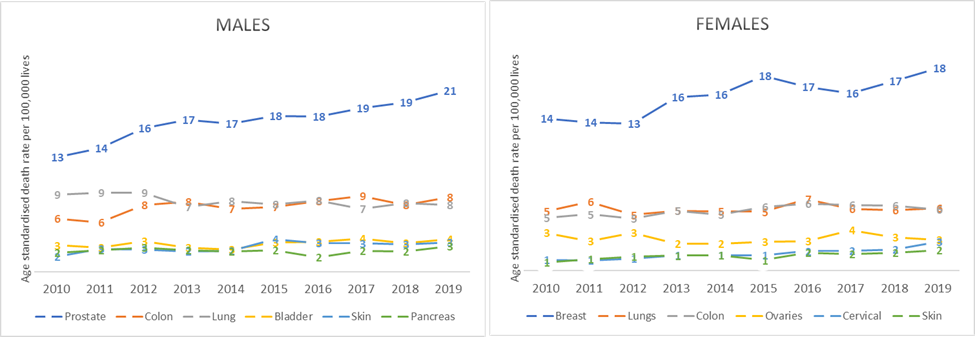
Figure 2: Death rates for cancers among Discovery Health administered medical scheme members, 2010-2019
Statistical modelling: Turning our attention to cancer survival rates
We analysed cancer survival rates within the Discovery Health member base using Cox proportional-hazards models across 86,569 data points (these are clients diagnosed with cancer and registered on our managed oncology benefit) and 4,301,871 individuals who did not develop cancer, aged 16 years and older.
In this report, we first fit a base model over our ten-year study period (1 January 2010 to 31 December 2019), taking the following covariates into account:
- Age
- Sex
- Cancer flag (A binary variable showing whether a person has been diagnosed with cancer or not).
All cancer types were combined in this base model.
Results: Base model
Table 1 shows that 4 388 440 (unique) medical scheme members were included in our study, with a median follow up time of 5.4 years.
|
Number of clients 2010-2019 |
Median follow up time per patient in years 2010-2019 (IQR) |
||||||
|
No cancer |
Cancer |
Total |
No cancer |
Cancer |
Total |
||
|
Male |
2,063,843 |
44,654 |
2,108,497 |
5.5 (2.3 - 10) yrs |
2.4 (0.9 - 4.8) yrs |
5.4 (2.3 - 10) yrs |
|
|
Female |
2,238,028 |
41,915 |
2,279,943 |
5.6 (2.4 - 10) yrs |
2.7 (1.1 - 5.1) yrs |
5.5 (2.4 - 10) yrs |
|
|
Total |
4,301,871 |
86,569 |
4,388,440 |
5.6 (2.4 - 10) yrs |
2.6 (1.0 - 4.9) yrs |
5.4 (2.3 - 10) yrs |
|
Table 1 : Summing up analyses conducted for the period 2010 to 2019 - showing number of clients included in the study and mean follow-up times.
A summary of the base model is provided below:
|
Hazard ratio |
Lower CI |
Upper CI |
P-value |
|
|
Cancer flag (Non cancer relative to cancer) |
0.198 |
0.195 |
0.201 |
<0.01 |
|
Age |
1.086 |
1.086 |
1.086 |
<0.01 |
|
Sex (Males relative to females) |
1.397 |
1.381 |
1.413 |
<0.01 |
Table 2: Hazard ratio and associated confidence intervals for cancer survival rate models put together using Discovery Health administered medical scheme member data
- Cox regression results can be interpreted as follows:
The P-value for each variable in the table above shows that all three variables, namely 'cancer flag', 'age' and 'sex', are highly statistically significant.
Hazard ratios give the size of the effect of covariates at any point in time. In our model, men face a 40% higher risk of death to cancer than women.
As expected, medical scheme members who did not have cancer were 80% less likely to die than those members diagnosed with the disease (with 95% confidence that the true value lies between 79.9% and 80.5%).
Overall, our results show that being diagnosed with cancer increases a scheme member's risk of death significantly and that this risk is higher for men and older people.
Medical scheme members' five-year absolute cancer survival rates across the top 4 most prevalent cancer types
Absolute risk refers to the risk an individual faces of a specific event taking place.
In our analysis, 'Absolute cancer survival rates' indicate how many people are still alive once a certain amount of time (in this case five years) has passed since their diagnosis - also factoring in a person's age and sex.
We applied a Cox proportional hazards model to determine absolute survival rates across the four most common cancers in the medical scheme member population (Figure 3). These are:
- Breast cancer
- Prostate cancer
- Colon cancer
- Lung cancer
We also looked at:
- Other cancer types
What were our findings across these cancer types?
Across our study group:
- Medical scheme members diagnosed with breast cancer had the highest five-year survival rates at 84.1%
- Those diagnosed with prostate cancer faced an 82.9% five-year survival rate.
- Those diagnosed with cancers of other primary sites/types faced a 58.5% five-year survival rate.
- Those diagnosed with colon cancer faced a 54.8% five-year survival rate.
- Those diagnosed with lung cancer had the lowest five-year survival rate at 13.6%.
- Medical scheme members who were not diagnosed with cancer had a 98% five-year survival rate (not shown on Figure 3).
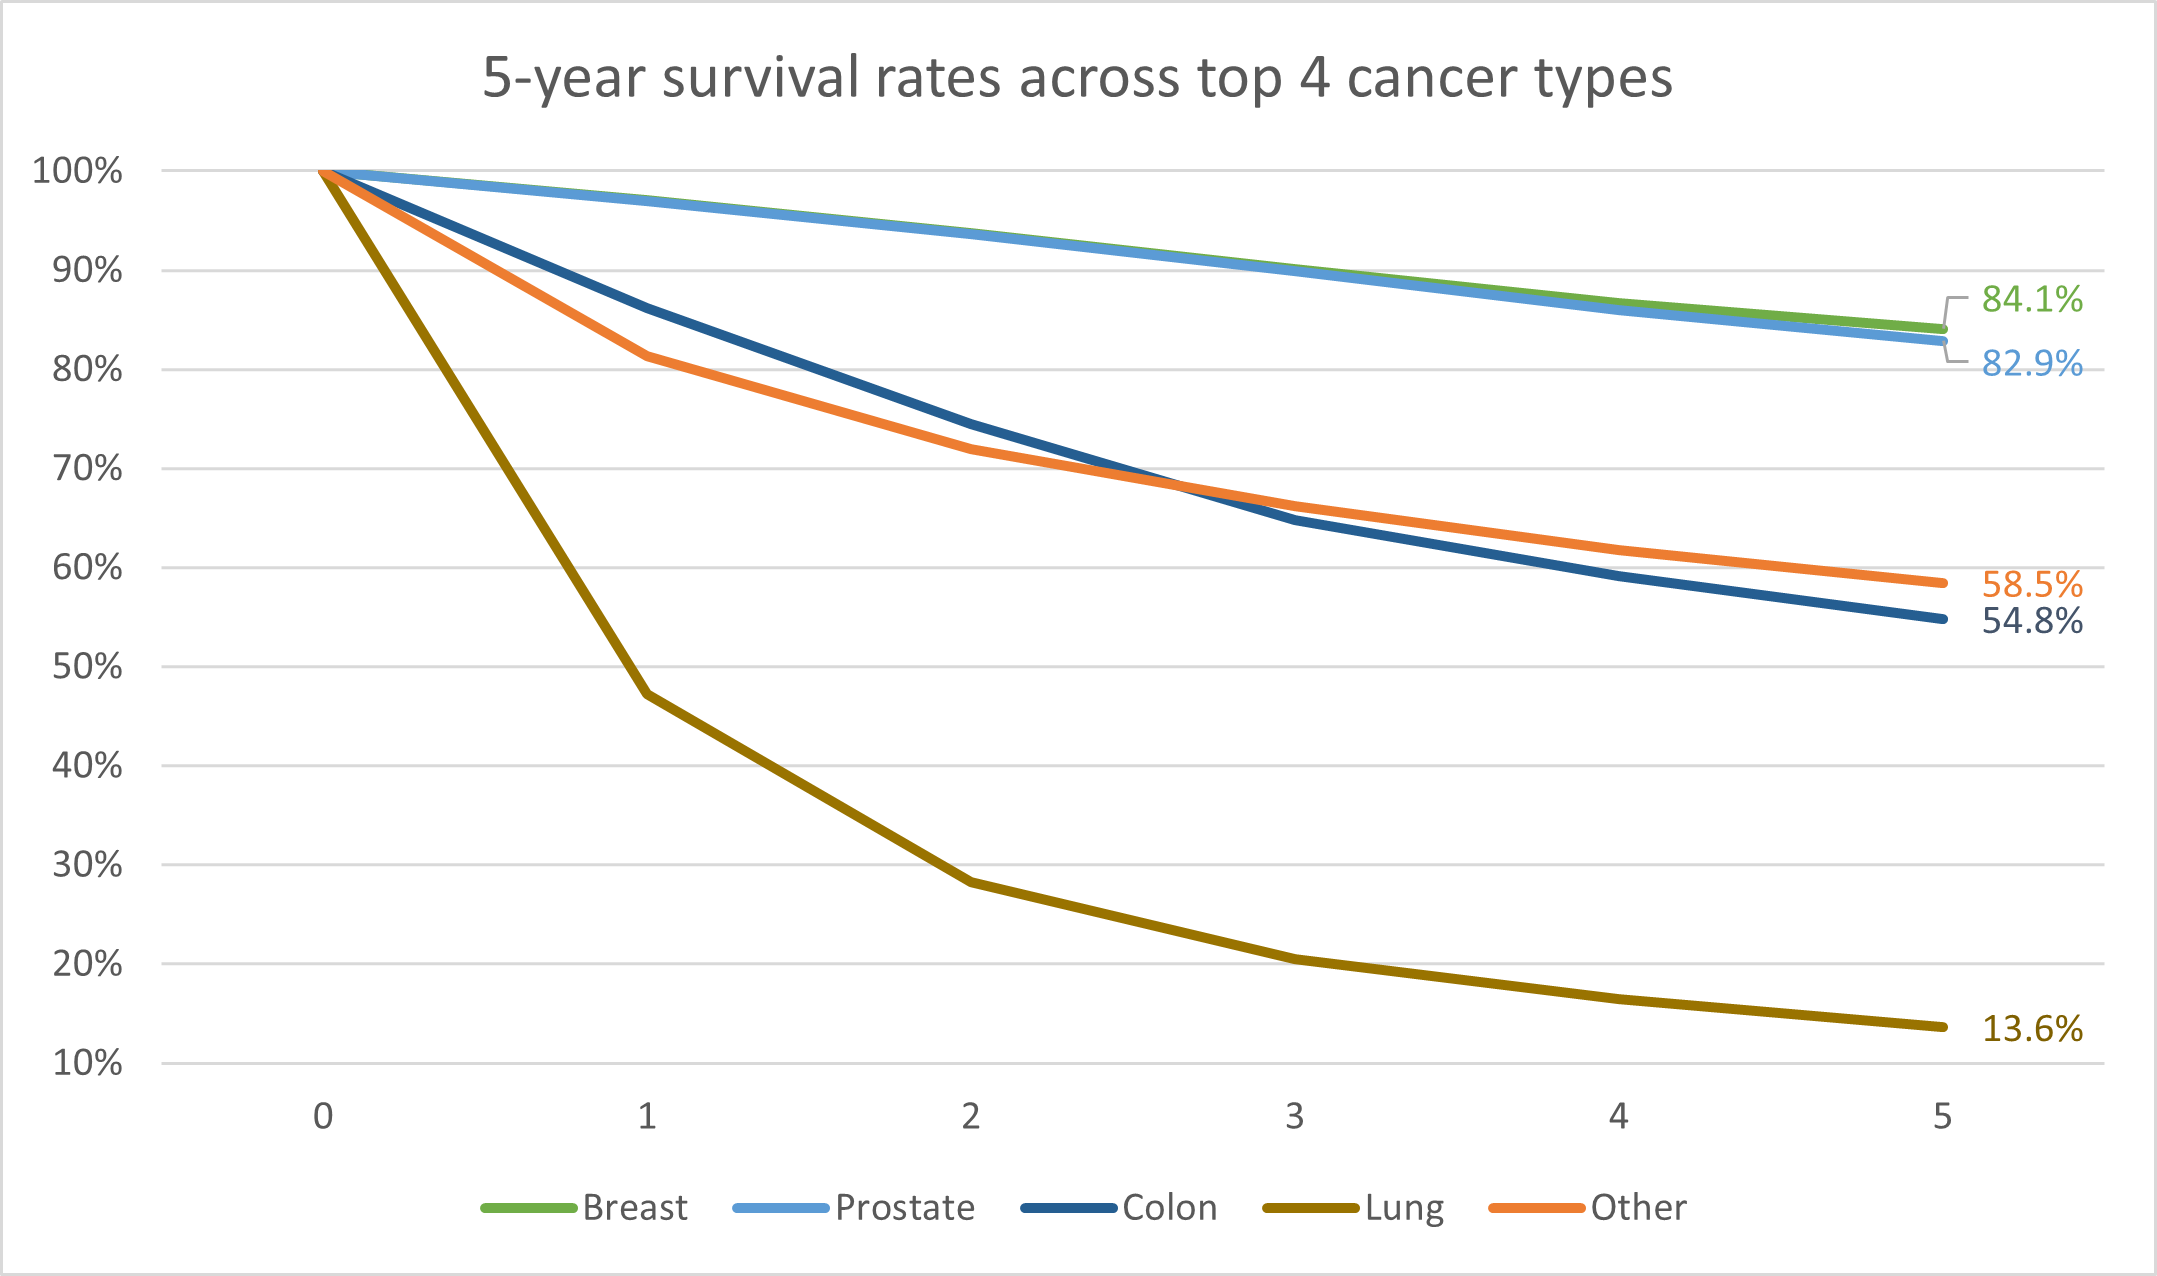
Figure 3: Five-year absolute survival curves for prostate, breast, lung, colon and other cancers among Discovery Health administered medical scheme members
How many people were included for each cancer type?
Table 3 shows the number of clients considered by primary cancer site, which were:
- 18,616 medical scheme members diagnosed with breast cancer
- 17,397 medical scheme members diagnosed with prostate cancer
- 7,387 medical scheme members diagnosed with colorectal cancer
- 4,501 medical scheme members diagnosed with lung cancer
- 86,394 medical scheme members diagnosed with cancers of other primary sites/types
|
Number of clients included in the analysis from 2010-2019, 16 years and older |
||||||||
|
No cancer |
Cancer |
Total |
||||||
|
Breast |
Prostate |
Colorectal |
Lung |
Other |
Total |
|||
|
Male |
2,063,843 |
0 |
17,397 |
4,061 |
2,569 |
20,449 |
44,476 |
2,108,319 |
|
Female |
2,238,028 |
18,616 |
0 |
3,326 |
1,932 |
18,044 |
41,918 |
2,279,946 |
|
Total |
4,301,871 |
18,616 |
17,397 |
7,387 |
4,501 |
38,493 |
86,394 |
4,388,265 |
Table 3: Number of clients analysed by primary cancer type, across our study period
How long were people monitored for across cancer types?
Overall, we followed up (Table 4):
- People who were not diagnosed with cancer for 5.6 person-years
- People diagnosed with breast cancer for 3.6 person-years
- People diagnosed with prostate cancer for 3.3 person-years
- People diagnosed with colorectal cancer for 2.2 person-years
- People diagnosed with lung cancer for 0.8 person-years
- People diagnosed with cancers of other primary sites/types for 2.2 person-years
|
Median follow up time per patient in years 2010 -2019 (IQR) |
||||||||||
|
No cancer |
Cancer |
Total |
||||||||
|
Breast |
Prostate |
Colorectal |
Lung |
Other |
Total |
|||||
|
Male |
5.5 (2.3 - 10) yrs |
3.3 (1.7 - 5.7) yrs |
2.2 (1.0 - 4.2) yrs |
0.7 (0.3 - 1.5) yrs |
2.1 (0.8 - 4.3) yrs |
2.4 (0.9 - 4.8) yrs |
5.4 (2.3 - 10) yrs |
|||
|
Female |
5.6 (2.4 - 10) yrs |
3.6 (1.7 - 5.9) yrs |
2.3 (1.0 - 4.3) yrs |
0.8 (0.4 - 1.8) yrs |
2.2 (0.8 - 4.5) yrs |
2.7 (1.1 - 5.1) yrs |
5.5 (2.4 - 10) yrs |
|||
|
Total |
5.6 (2.4 - 10) yrs |
3.6 (1.7 - 5.9) yrs |
3.3 (1.7 - 5.7) yrs |
2.2 (1.0 - 4.3) yrs |
0.8 (0.3 - 1.6) yrs |
2.2 (0.8 - 4.4) yrs |
2.6 (1.0 - 4.9) yrs |
5.4 (2.3 - 10) yrs |
||
Table 4: Median follow up time, by primary cancer type
Five-year relative survival rates of cancer patients across the top 4 most prevalent cancer types
'Relative risk' refers to the risk of an event in one group compared to another.
So, when it comes to cancer, 'relative survival rate' refer to the survival rate in a group of people diagnosed with cancer over time, compared to a group of cancer-free people. We calculate the percentage of people who will be alive five years after diagnosis with a certain cancer, relative to a group of cancer-free individuals.
A hypothetical example:
-
If the five- year absolute survival rate for women with cervical cancer is at 60% this means that 60 out of every 100 women diagnosed with cervical cancer will be alive five years after diagnosis. And if the overall absolute survival rate for women in general (women who do not have cancer) over those five years is also 60% this implies that the relative cancer survival rate for cervical cancer is 100% (60/60 x 100) - in this example, being diagnosed with cervical cancer does not decrease the five-year survival rate women face.
-
If in the above, five- year absolute survival rate for women with cervical cancer is 60%, and for women without cancer is 95% this implies that the relative cancer survival rate for cervical cancer is 63% (60/95 x 100).
Researchers also calculate relative cancer survival statistics for specific cancer stages (cancer stage is based on the cancer's location and whether it has spread) as survival statistics are affected by cancer stage.
Relative survival rates were used to provide an objective measure of the probability of cancer survival in the absence of other causes of death (mortality risk not influenced by other factors)5. Looking at prostate, breast, colon and lung cancer in this way gave us a good measure of survival rates across time and between cohorts.
We also compared our findings to data from the Unites States, United Kingdom and Australia (using online search statistics related to survival rates by primary cancer type).
Figure 4 summarises our relative cancer survival rate findings for prostate, breast, colon and lung cancer in our sample population:
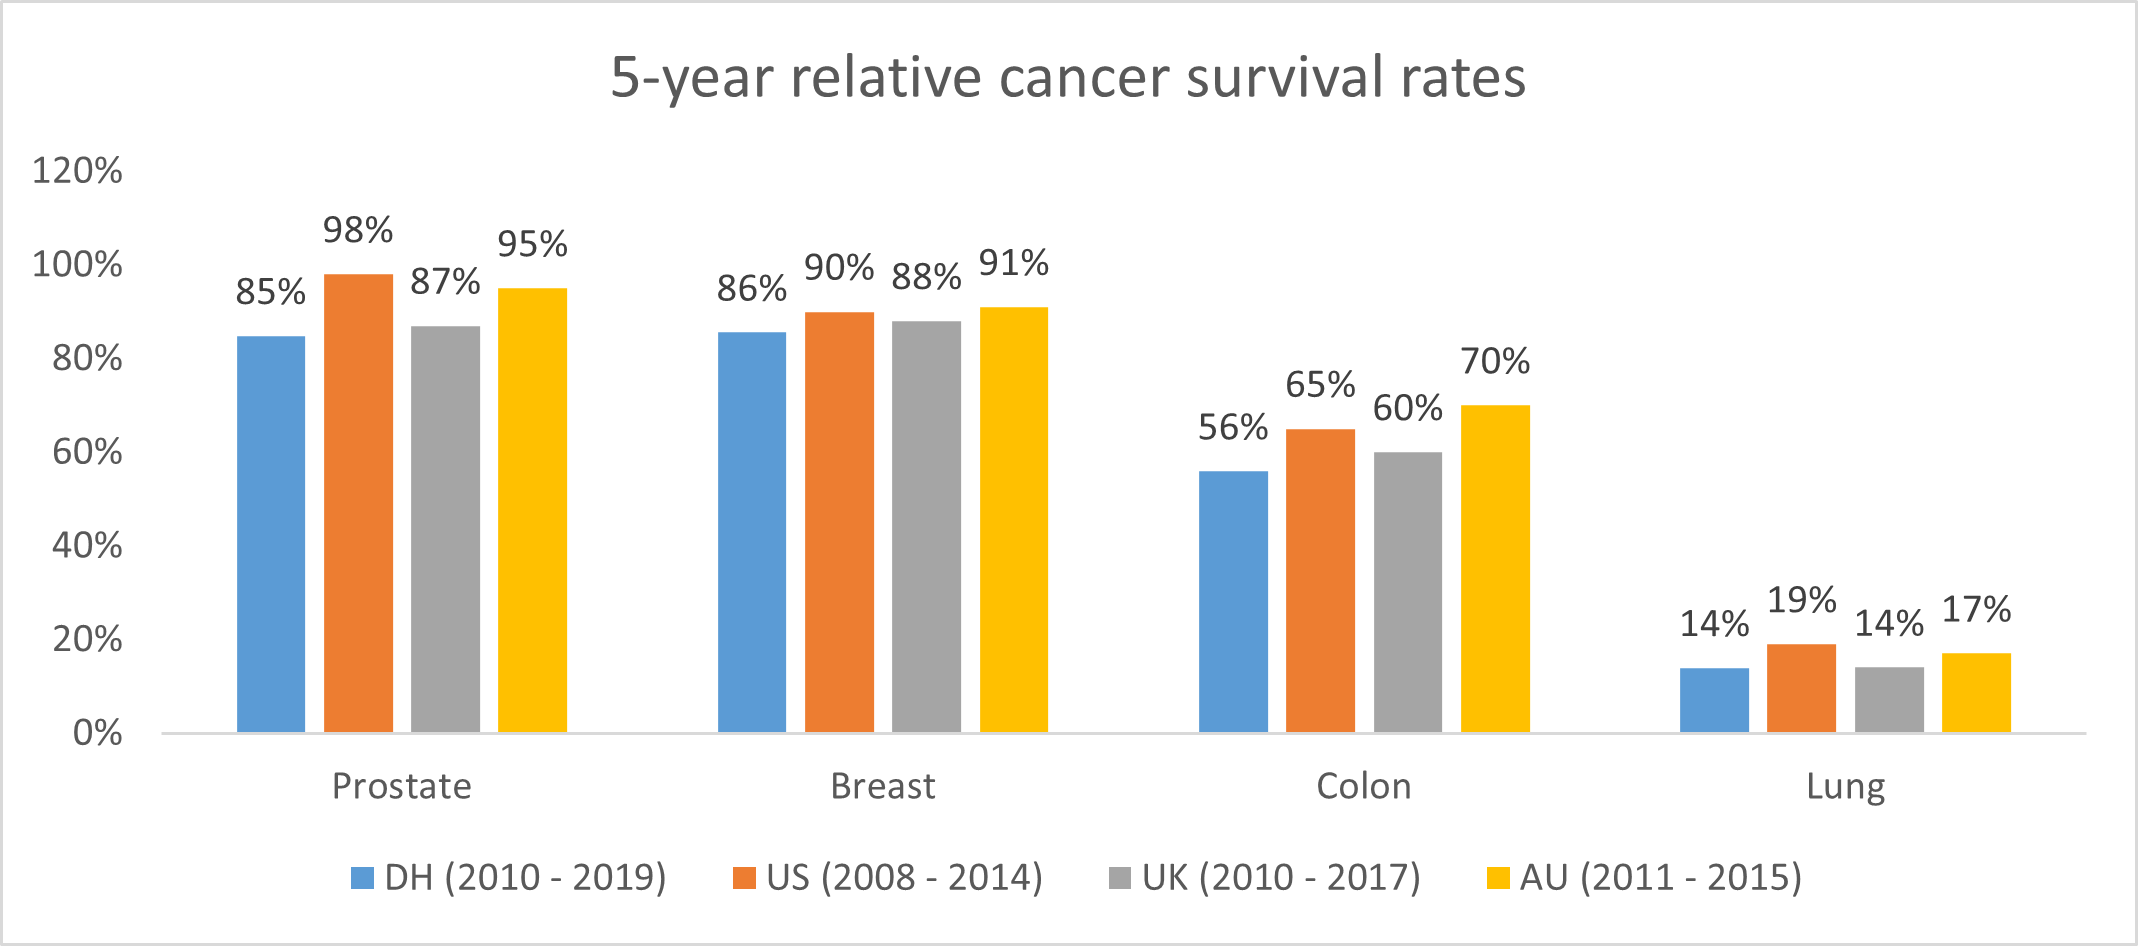
Figure 4: Comparison of relative cancer survival rates for prostate, breast, colon and lung cancers among members of Discovery Health administered medical schemes, versus rates recorded in US6, UK7 and Australian8 populations.
Medical scheme members diagnosed with:
- Prostate cancer have an 85% relative cancer survival rate. This means our population's outcomes are similar to people diagnosed with this cancer type in the UK population (87%) and lower than the US and Australian populations.
- Breast cancer have survival outcomes (86%) similar to people diagnosed with this cancer type in the UK (88%), and slightly lower than people in the US and Australia.
- Colon cancer have survival outcomes (56%) lower than people diagnosed with this cancer type in the British population (60%), 11% lower than American people and 14% lower than Australian people.
- Lung cancer have survival outcomes identical to people diagnosed with this cancer type in the UK (14%), while slightly lower than the Australian population (17%) and lower than the US population (19%).
Five-year relative cancer survival rates for the paediatric population
Cancer is responsible for 4% of deaths in the paediatric population (defined as 15 years old and younger) in the Discovery Health administered medical scheme population. Table 5 shows that the paediatric population's overall mortality rate per 100 000 lives is lower than that of the population aged 65 years and older - at 72 versus 3,219 deaths per 100,000 lives respectively.
|
Age <=15 years old |
Age >=65 years old |
Age 16-64 |
|||||||||
|
Underlying cause of death |
N |
% |
Deaths per 100 000 person years |
Underlying cause of death |
N |
% |
Deaths per 100 000 person years |
Underlying cause of death |
N |
% |
Deaths per 100 000 person years |
|
All other causes |
2748 |
84.4% |
61.1 |
All other causes |
14122 |
49.3% |
115.5 |
Malignant neoplasms |
13227 |
26.8% |
863.7 |
|
Accidents (unintentional injuries) |
178 |
5.5% |
4.0 |
Malignant neoplasms |
6928 |
24.2% |
56.7 |
All other causes |
12995 |
26.4% |
848.6 |
|
Malignant neoplasms |
131 |
4.0% |
2.9 |
Diseases of heart |
2470 |
8.6% |
20.2 |
Diseases of heart |
10425 |
21.1% |
680.7 |
|
Influenza and pneumonia |
65 |
2.0% |
1.4 |
Diabetes Mellitus |
1411 |
4.9% |
11.5 |
Diabetes Mellitus |
2923 |
5.9% |
190.9 |
|
Diseases of heart |
51 |
1.6% |
1.1 |
Accidents (unintentional injuries) |
914 |
3.2% |
7.5 |
Cerebrovascular diseases |
2480 |
5.0% |
161.9 |
|
Other |
82 |
2.5% |
1.8 |
Other |
2790 |
9.7% |
22.8 |
Other |
7250 |
14.7% |
473.4 |
|
Total |
3255 |
100% |
72.4 |
49300 |
100% |
3219.2 |
28635 |
100% |
234.1 |
||
Table 5: Underlying cause of death by age group for Discovery Health administered medical scheme members for 2012-2015 & 2018 - 2019 (periods with underlying cause of death documented)
Published reports from the South African public sector demonstrate an overall survival rate of approximately 50% in children 9 , 10 for all cancers. This rate is lower than three-year survival rates reported on in upper- and middle- income settings in parts of South America 11 (62% survival rate).
Given, the low probability of deaths to cancer in the Discovery Health paediatric population, it was not possible to obtain statistically significant survival rates per cancer type, and therefore the survival rate was analysed across all cancer types.
In the Discovery Health paediatric population (medical scheme members aged 15 years and younger), the relative five-year cancer survival rate was 78%, across all cancer types (Figure 5).
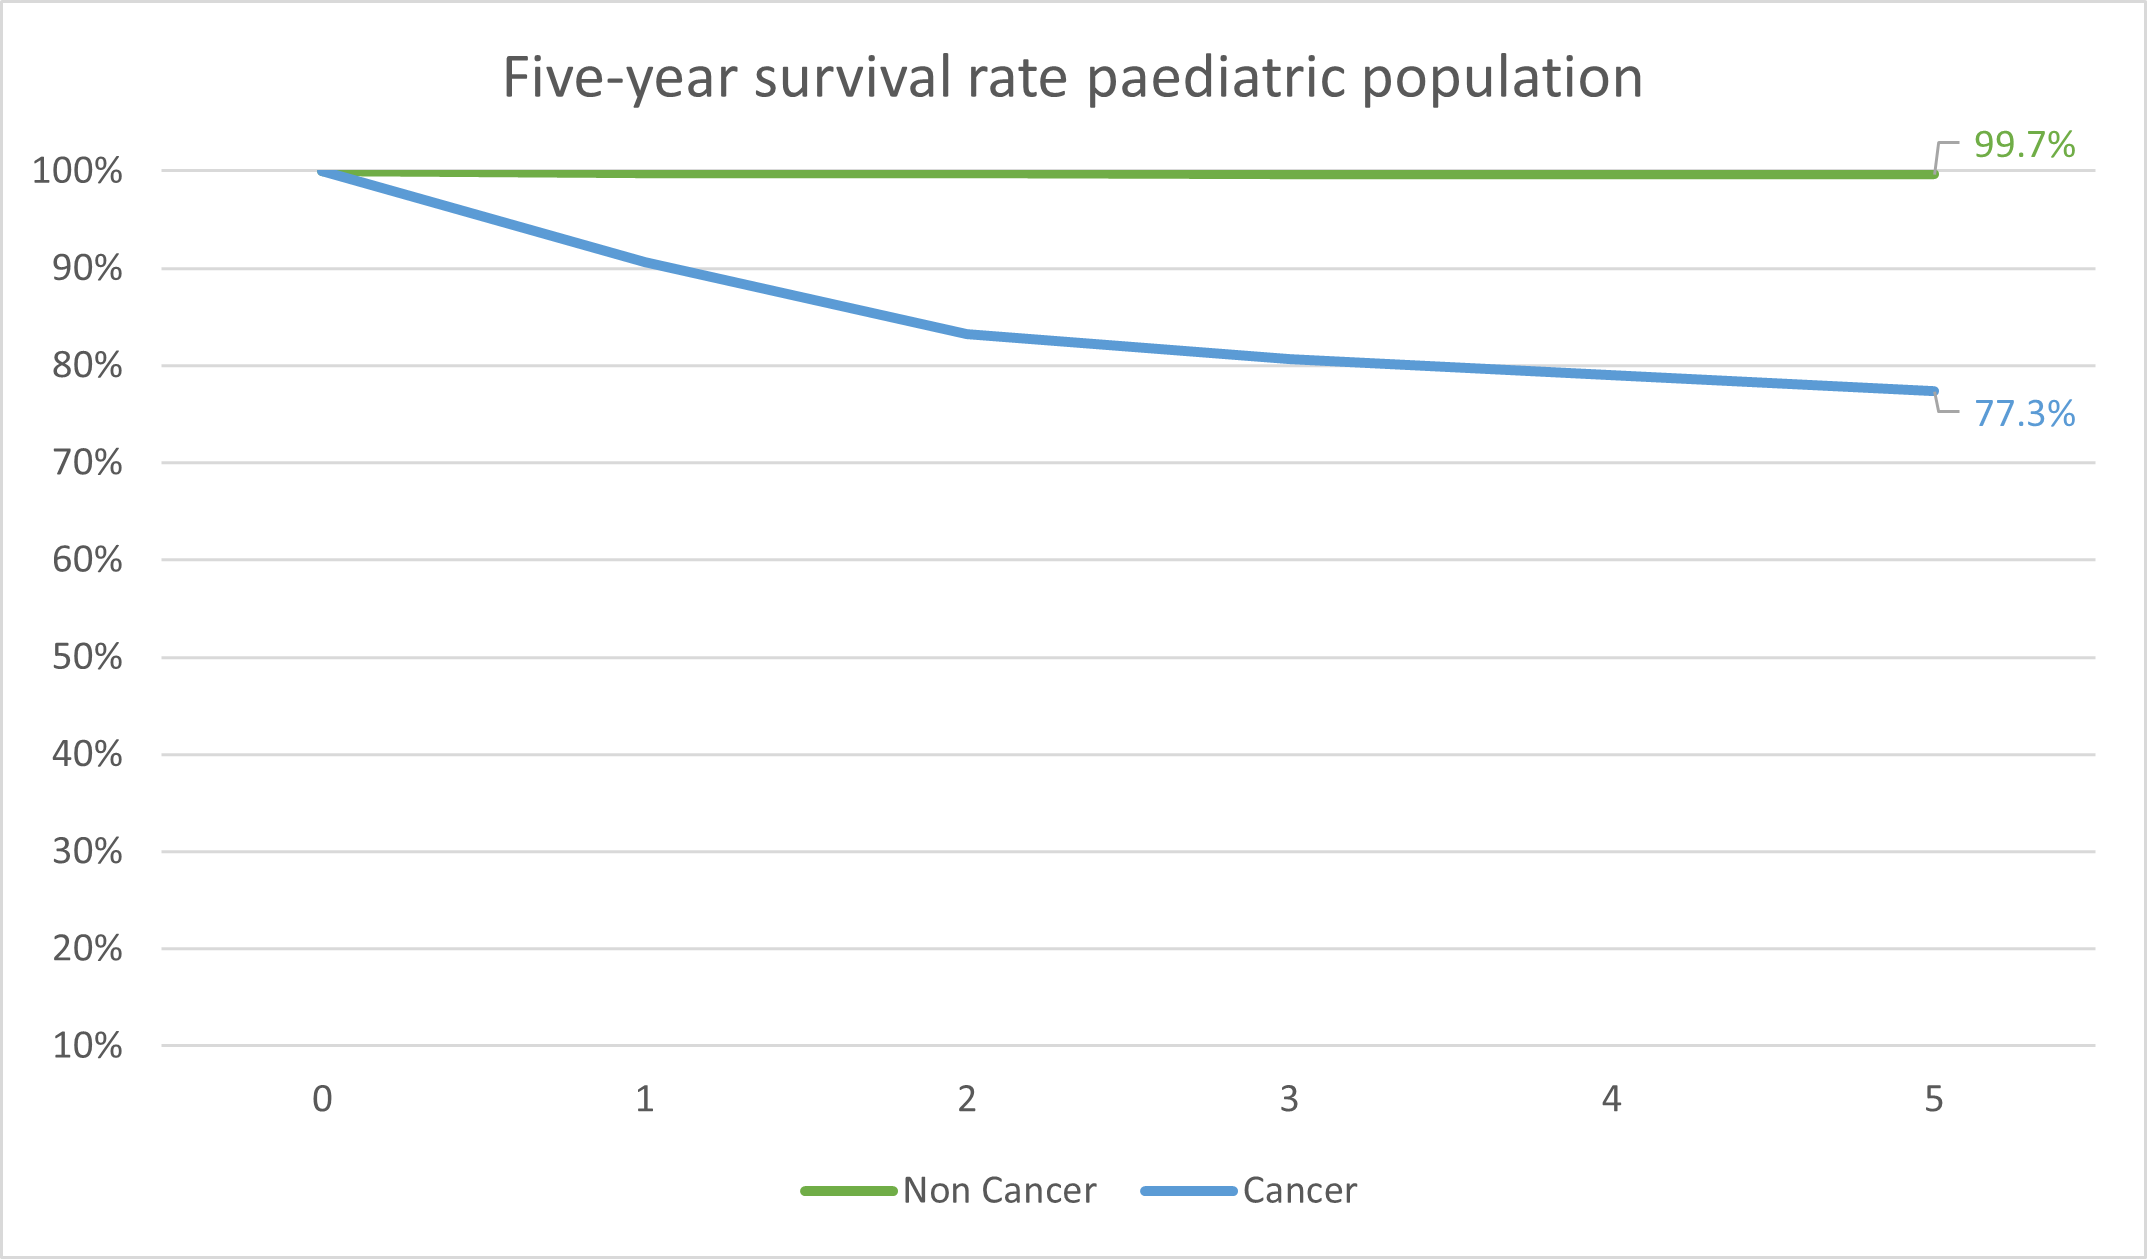
Figure 5: Five-year survival rates in the Discovery Health paediatric population diagnosed with cancer and those in members who do not have cancer.
Oncology diagnoses for the paediatric population by primary cancer, are provided in the table below. The most common cancers in children (aged 15 and younger) are lymphomas, cancers of the nervous system / brain), leukaemia's and cancers of the kidneys respectively.
|
Age <=15 years old |
|||
|
Primary cancer |
Number of diagnoses |
% |
Diagnoses per 100 000 person years |
|
Lymphoma, Lymphoblastic |
224 |
22.9% |
3.0 |
|
Central Nervous System |
139 |
14.2% |
1.9 |
|
Leukemia, Other Types |
93 |
9.5% |
1.3 |
|
Kidneys |
79 |
8.1% |
1.1 |
|
Primary Bone |
42 |
4.3% |
0.6 |
|
Other |
401 |
41.0% |
5.5 |
|
Total |
978 |
100.0% |
13.3 |
Table 6: Number of cancer diagnoses from 2010 to 2019 by primary cancer for the Discovery Health paediatric population (aged 15 and younger).
Years of life lost as a result of premature death due to cancer
Death rates alone don't fully explain the impact a disease has on a country, its society, economy and so on. Another more robust means of assessing the extent to which a disease has impact is looking at 'Years of Life Lost' (YLL). YLL estimates the years of potential life lost due to premature deaths - a summary measure of premature mortality.
Figure 6 shows that breast, lung, colorectal and pancreatic cancers are responsible for the most YLL in the Discovery Health administered medical scheme population.
Childhood cancers are responsible for the greatest average YLL.
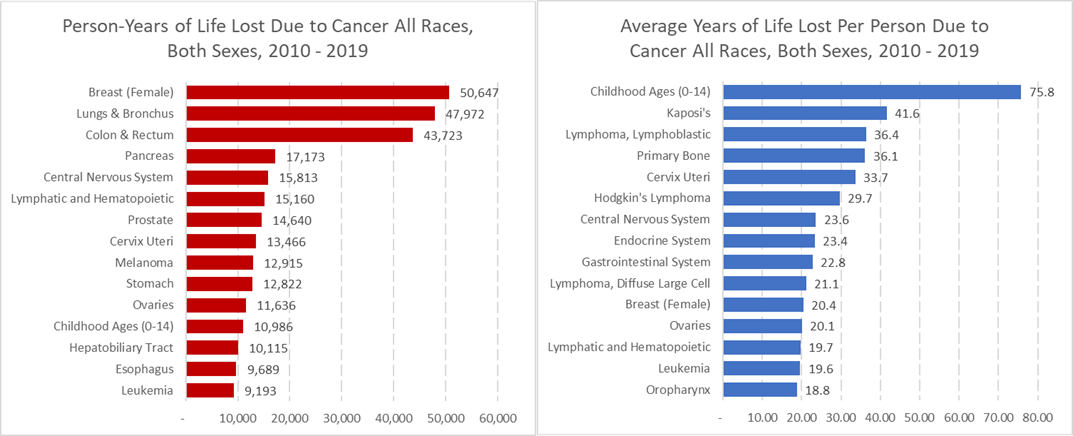
Figure 6: YLL to Cancer, 2010-2019 among Discovery Health administered medical scheme members
Discussion and conclusion
Prior to the COVID-19 pandemic, cancer was the leading cause of death for the adult (above age 16) Discovery Health administered medical scheme member population.
This research was performed to better understand five-year survival rates among Discovery Health administered medical scheme members diagnosed with cancer. The analysis is strong considering that it relies on a decade of data in a significant sample of people (4 388 440 individuals with a 5.4-year median follow up time).
Importantly, this analysis offers the first publicly available information around absolute and relative cancer survival rates specific to South Africa's privately insured population and across four common cancer types.
In summary, our findings around absolute survival rates show that medical scheme members diagnosed with:
- Breast cancer had the highest five-year survival rates at 84.1%
- Prostate cancer faced an 82.9% five-year survival rate.
- Colon cancer faced a 54.8% five-year survival rate.
- Lung cancer had the lowest five-year survival rate at 13.6%.
- And, also - cancers of other primary sites/types faced a 58.5% five-year survival rate.
In summary, our findings around relative survival rates show that medical scheme members diagnosed with:
- Prostate cancer have an 85% relative cancer survival rate.
- Breast cancer have an 86% relative cancer survival rate.
- Colon cancer have a 56% relative cancer survival rate.
- Lung cancer have a 14% relative cancer survival rate.
Also, relative five-year cancer survival rates for the Discovery Health population were similar to rates reported in American, British and Australian populations. Survival outcomes measured in our client base are therefore comparable to rates reported on in other countries.
In the Discovery Health paediatric population (medical scheme members aged 15 years and younger), the relative five-year cancer survival rate was 78%, across all cancer types (Figure 5). Encouragingly, relative survival rates for paediatric cancers for DH clients (77%) compare favourably against rates reported on in low- and middle-income countries (62%).
And, breast, lung and colon cancers are responsible for the most YLL amongst the adult client base.
Acknowledgements
A special acknowledgement to Amos Musgova, who worked diligently alongside us over many months while at Discovery Health to produce a prior first version of these insights
References
- https://pubmed.ncbi.nlm.nih.gov/22658655/
- https://www.who.int/news-room/fact-sheets/detail/cancer
- https://www.cancer.gov/about-cancer/understanding/statistics
- chrome-extension://efaidnbmnnnibpcajpcglclefindmkaj/https://www.health.gov.za/wp-content/uploads/2020/11/national-cancer-strategic-framework-2017-2022-min.pdf
- Ederer, A. C. (1961). The relative survival rate: a statistical methodology. Natl Cancer Inst Monogr, 101-21
- US: SEER : https://seer.cancer.gov/statfacts/
- UK: Public Health England https://www.gov.uk/government/organisations/public-health-england; UK Prostate: Office for National Statistics (2013-2018) https://www.ons.gov.uk/
- Australian Institute of Health and Welfare https://www.aihw.gov.au/
Poyiadjis S, Wainwright L, Naidu G, et al. The Saint Siluan Warning Signs of Cancer in Children: Impact of Education in Rural South Africa. Pediatr Blood Cancer 2011; 56(2):314- 316. http://dx.doi.org/10.1002/pbc.22853 [PMID: 21058290] - Stones DK, De Bruin GP, Esterhuizen TM, Stefan DC. Childhood cancer survival rates in two South African units. S Afr Med J. 2014 May 19;104(7):501-4. doi: 10.7196/samj.7882.
- Moreno F, Dussel V, Orellana L; ROHA network Childhood cancer in Argentina: Survival 2000- 2007. Cancer Epidemiol. 2015 Aug;39(4):505-10. doi: 10.1016/j.canep.2015.04.010.
Interested in knowing more or reporting on these findings?
Please contact us on MEDIA_RELATIONS_TEAM@discovery.co.za to request any updated data available since publication and to obtain any further context required.
Did you find this post interesting?
Please visit our Discovery Health Insights Hub for a range of analyses and insights shared by our Discovery Health Intelligence Team over the past three and a half years and spanning a variety of health-related themes.
All information shared on this page is based on perspectives gained from analysis of figures and trends emanating from discovery health's data pool. The analysis, which is conducted by discovery health's actuarial and data scientist team, aims to encourage industry dialogue. This content is shared for educational and informational purposes only. It does not constitute peer-reviewed, published scientific research, and hence should not be interpreted as such or used as a basis for altering treatment decisions.

15 min read
Deep dive: Admission rates across South Africa's four COVID-19 waves confirm Omicron-driven fourth wave's lower severity, and more.
07 July 2022
Authors: Chana Suttner (Actuary, Discovery Health),Michael Cohen (Actuarial Analyst, Discovery Health), Shirley Collie (Chief Healthcare Analytics Actuary, Discovery Health

13 min read
Long COVID symptoms, impact on carrying out daily activities: Survey of just over 7,000 medical scheme members reveals key insights
16 June 2022
Authors: Shirley Collie (Chief Healthcare Analytics Actuary, Discovery Health), Lizelle Steenkamp (Senior Healthcare Statistician, Discovery Health), Lebohang Radebe (Data Scientist, Discovery Health), Dr Smybinn Mathews (Clinician, Discovery Health) and Dr Dave Jacobs (Senior Clinician and Clinical Classification System Architect, Discovery Health)

13 min read
Discovery's COVID-19 personal resilience index predicts an individual's resilience to serious COVID-19 illness
23 May 2022
Authors: Lizelle Steenkamp (Senior Healthcare Statistician at Discovery Health), Tommy Chen (Actuary at Discovery Health), Jared Champion (Senior Actuary at Discovery Health) and Donald Ntjana (Senior Data Scientist at Discovery Health)