SAMJ publication: Investigating death rates across four conditions to measure quality of care in 204 local, private hospitals

Developing meaningful ways to measure the quality of hospital care can improve services, save lives and reduce costs. A first-of-its-kind study, published in the South African Medical Journal, evaluates the use of risk-adjusted death rates, based on hospital claims, to assess the quality of care.
You can't improve what you don't measure
South Africa's private healthcare sector has long operated mainly on a fee-for-service model. These sorts of models are known for promoting volume of care over value of care.
Here, "value" refers to the quality of outcomes achieved per cost at which this care is achieved.
Around the world and to some extent in South Africa, there is a shift away from fee-for-service models to value-based care models. These models promoted the value achieved over volume of care.
This makes it important to develop systems through which to measure and report on quality-of-care outcome metrics. Death rates (or standardised mortality rates) are a key indicator of quality of care. International studies have shown that reporting of mortality measures does lead to improvements in the quality of care delivered.1
Discovery Health's Health Intelligence team publishes paper in the South African Medical Journal presenting a robust methodology around risk-adjustment for SMRs
Discovery Health uses claims data from members of all administered medical schemes to calculate standardised mortality rates (SMRs) by condition. Discovery Health then shares this information with hospital and healthcare professional teams through standardised reports intended to help clinicians to examine variations and improve care.
However, to be meaningful measurements of quality, SMRs must be risk-adjusted for patient characteristics that could increase or decrease the risk of death
In May 2019, Discovery Health's Health Intelligence team published a paper in the South African Medical Journal presenting a robust methodology around risk-adjustment for SMRs. Since this data was released in 2019, we updated results that are shared annually with Discovery Heath's network of hospitals and healthcare professionals.
- Read our May 2019 study in full.
We described and evaluated the validity of risk-adjustment methods to produce SMRs that account for patient risk factors affecting death rates in medical scheme members admitted for four conditions:
- Acute myocardial infarction (also known as a heart attack)
- Ischemic stroke (when a clot cuts off blood to part of the brain so the brain gets less or no oxygen)
- Pneumonia (a serious infection in the lungs) and;
- Coronary artery bypass graft procedures (taking a blood vessel from one part of the body and attaching it to the coronary artery to redirect blood around a section of blocked heart artery).
According to Discovery Health claims data, collectively, these conditions contributed to 14% of all adult deaths occurring within 30 days of a hospital admission over our study period, from 2014 to 2016).
Our 2019 study reviewed more than 16,000 deaths from a nationally representative sample of hospitals
Initially 18,203 deaths were included in the data set and causes of death were manually audited. After this process, 16,446 deaths and 46,714 admissions from 204 hospitals were included in the final analysis. The sample of hospitals selected was considered to be nationally representative.
Condition-specific data was only extracted from hospitals that reported at least 25 cases of one of the four conditions during the three-year study period.
- Recap: Our analysis looked at claims data for deaths related to acute myocardial infarction, stroke, pneumonia and coronary artery bypass graft procedures from January 2014 to December 2016.
SMRs for these conditions were calculated by dividing the sum of all deaths for each of the four conditions within 30 days of admission, by all the admissions for that condition at the same hospital over the same period of time - or:
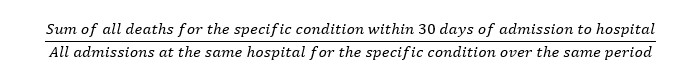
Deaths were included regardless of whether they occurred in- or out-of-hospital.
- Why look at a 30-day period from admission? Thirty days from admission was considered an appropriate time frame in which a death could reasonably be attributed to care in hospital. Also, as explained in the paper, many current hospital interventions are known to decrease the risk of death within 30 days of an admission.
What criteria were used to determine deaths included in the study?
Deaths were included in the study based on specific facility and patient criteria.
- For stroke, pneumonia and acute myocardial infarction, claims data were included for patients who were older than 18 years of age.
- In the case of coronary artery bypass graft procedures patient claim data were limited to those older than 40 years of age.
- Ischaemic strokes accounted for 92% of all strokes recorded in the three-year data set.
-
- Haemorrhagic stroke cases were excluded as ischaemic stroke accounted for the majority of strokes and ischaemic stroke has different causes, treatments and prognoses than haemorrhagic stroke.
Patient claim data was similarly excluded from the analysis if patients had been:
- Pregnant
- Discharged against medical advice
- Admitted with pneumonia or acute myocardial infarction but had been discharged after less than two days due to uncertainty about whether diagnoses in these cases had been accurate, given short hospital stays; or
- Underwent both a coronary artery bypass graft as well as another major heart, vascular or thoracic procedure.
For deaths that had occurred among patients transferred between hospitals, deaths were allocated to the receiving hospital only if they had accepted the patient less than 24 hours after their primary hospital admission.
Modelling to measure risk
Measuring mortality rates allows us to determine whether more deaths have happened than they would ordinarily be expected. Also, mortality due to illness is the single most important and serious outcome measure of care.
However, the reality is that some patients die despite receiving the best care possible. So, for death rates to be a meaningful and fair indicator of hospital performance, they need to account for patient differences that may impact the risk of dying. Next, they need to separate the effect of these risk factors from any risk attributable to lower quality of care.
To do this, we built a two-step statistical model based on patient claim data. First, to assess each person's risk of dying, we used a newer machine learning algorithm known as gradient boosting machines (GBMs) to develop and predict a patient's risk of death given:
- Age
- Sex
- Disease stage
- Level of clinical emergency
- How often they had sought care and had symptoms in the previous year; and
- Whether they had other chronic illnesses.
GBM models are able to divide data according to risk more accurately than conventional statistical regression models. They are therefore more predictive while also being less prone to some types of statistical errors.1 In testing, our GBM model was more accurate than conventional linear statistical regression.
Once we were able to predict a patient's risk of death based on condition and the characteristics above, we looked at the per-facility death rates for each of the four conditions across our sample of 204 hospitals.
By using modelling to control for the risk of death attributable to patient-level risk factors, we were able to reveal excess deaths that we hypothesize are explained largely by variations in quality of care.
Death rates were on par or better than those in the United States
When controlling for variation among patients, the national average mortality rate for each of the four conditions surveyed ranged from 3.2% to 9.7%, as outlined in the table below.
Although the study did not set out to compare mortality rates with global benchmarks, it is interesting to note that these death rates were either similar to or lower than those found in the United States.
|
Condition |
Total admissions |
Total deaths |
*National average mortality rates controlling for patient and hospital risk factors |
Range in hospital mortality rates across conditions analysed |
|
Pneumonia |
29159 |
1556 |
5.3% |
0-17.7% |
|
Stroke |
8809 |
707 |
8% |
0 - 34.8% |
|
Acute myocardial infarction (heart attack) |
5791 |
564 |
9.7% |
0 - 32.1% |
|
Coronary artery bypass graft |
2955 |
95 |
3.2% |
0 - 14.5%
|
Table 1: Results for the measurement period over which our SMRs were calculated. When the sample was limited to hospitals with adequate numbers of cases to allow for the calculation of a mortality rate, death rates for heart attacks and coronary artery bypass grafts were no different from the national average.
*The national average referred to here is the average of SMRs for all hospital systems in our analysis, which is restricted to members of Discovery Health administered client schemes included in the numerator and denominator populations..
Analysis reveals wide variation in stroke, pneumonia care suggesting quality-of-care issues
Only a relatively small number of hospitals reported sufficient cases of acute myocardial infarction (62) and coronary artery bypass graft (35) to be included in the study. In facilities like these mortality rates were on par with the national average.
National average refers to the average of SMRs for all hospital systems in our analysis. [See Table 2 in our study].
However, the analysis revealed wide variation in terms of mortality rates for pneumonia and stroke. Although nearly 96% of hospitals reported stroke mortality rates on par with or better than the national average some under-performing hospitals revealed rates almost four times that.
Outcomes were most concerning for pneumonia, where almost one in 10 hospitals reported death rates worse than the national average of all hospitals in the study for the period between 2014 and 2016.
A measure we can't afford to ignore
Our study is the first to apply robust, internationally-accepted methodology to construct a claims-based model for risk-adjusted, hospital SMRs in a South African private healthcare sector setting.
We believe that measuring and reporting on quality-of-care metrics, such as SMRs, is a valuable approach to improving patient care, saving lives and reducing healthcare costs. As such, we argue this methodology marks an important milestone in developing an understanding of variations in quality of care delivered in the private healthcare setting in South Africa.
Although hospital groups and facilities may struggle to replicate this particular claims-based methodology owing to, for instance, a lack of data, we believe other private medical funders can utilise this methodology to report and reflect on these valuable outcomes. Similarly in public sector facilities, clinical data such as bedside case notes can be used to examine SMRs across hospital systems to track improvement.
Because the analysis reviewed a three-year period ending in 2016, data does not reflect hospital standings today.
Still, the analysis revealed a handful of hospitals providing superior care based on our risk-adjusted analysis of mortality rates - most notably in the treatment of pneumonia.
- Relevance to the current context:
Since this data was released in 2019, we have updated these results annually and they are shared with Discovery Heath's network of hospitals and healthcare professionals.
Study authors
Roshini Moodley Naidoo (Head and General Manager of Strategic Risk Management, Discovery Health), Geraldine Timothy (Head of Quality of Care, Discovery Health), Lizelle Steenkamp (Senior Healthcare Statistician, Discovery Health), Shirley Collie (Chief Healthcare Analytics Actuary, Discovery Health), Mike Greyling (Biostatistician, DMSA)
- Donabedian A. Evaluating the quality of medical care. Milpark Q 2005;83(4):691-729. https://doi.org/10.1111/j.1468-0009.2005.00397.x
- Friedman J, Hastie T, Tibshirani R. Additive logistic regression: A statistical view of boosting. Ann Stat 2000;28(2):337-407. https://doi.org/10.1214/aos/1016218223
Interested in knowing more or reporting on these findings?
Please contact us on MEDIA_RELATIONS_TEAM@discovery.co.za to request any updated data available since publication and to obtain any further context required.
Did you find this post interesting?
Consider reading another of our posts, detailing the COVID-19 pandemic's impact on five high-volume elective procedures (some are surgeries and some diagnostic procedures). We find fascinating trends across our 2019 to 2022 study period.
Disclaimer
All information shared on this page is based on perspectives gained from analysis of figures and trends emanating from discovery health's data pool. The analysis, which is conducted by discovery health's actuarial and data scientist team, aims to encourage industry dialogue. This content is shared for educational and informational purposes only.

15 min read
Deep dive: Admission rates across South Africa's four COVID-19 waves confirm Omicron-driven fourth wave's lower severity, and more.
07 July 2022
Authors: Chana Suttner (Actuary, Discovery Health),Michael Cohen (Actuarial Analyst, Discovery Health), Shirley Collie (Chief Healthcare Analytics Actuary, Discovery Health

13 min read
Long COVID symptoms, impact on carrying out daily activities: Survey of just over 7,000 medical scheme members reveals key insights
16 June 2022
Authors: Shirley Collie (Chief Healthcare Analytics Actuary, Discovery Health), Lizelle Steenkamp (Senior Healthcare Statistician, Discovery Health), Lebohang Radebe (Data Scientist, Discovery Health), Dr Smybinn Mathews (Clinician, Discovery Health) and Dr Dave Jacobs (Senior Clinician and Clinical Classification System Architect, Discovery Health)

13 min read
Discovery's COVID-19 personal resilience index predicts an individual's resilience to serious COVID-19 illness
23 May 2022
Authors: Lizelle Steenkamp (Senior Healthcare Statistician at Discovery Health), Tommy Chen (Actuary at Discovery Health), Jared Champion (Senior Actuary at Discovery Health) and Donald Ntjana (Senior Data Scientist at Discovery Health)