Post-COVID series (1 of 3): What's our risk of going to hospital when we get COVID-19, and in the twelve months that follow?

For some people, recovery from COVID-19 is followed by a period of ongoing healthcare complications. In this - the first of three articles in our series - we share our analysis of medical scheme members' long-term clinical outcomes and hospital admission risk during infection with COVID-19 and in the 12 months after recovery.
Author names: Discovery Health's Shirley Collie (Chief Healthcare Analytics Actuary), Lebohang Radebe (Data Scientist), Tommy Chen (Actuary), Jared Champion (Senior Actuary), Donald Ntjana (Senior Data Scientist), Dr Dave Jacobs (Senior Clinician and Clinical Classification System Architect), Dr Smybinn Mathews (Clinical Risk Specialist), Sameera Haneef (Senior Actuary), Lizelle Steenkamp (Senior Healthcare Statistician) and Matt Zylstra (Senior Actuary)
A three-part analysis and article series
- This is the first of three articles assessing Discovery Health administered medical schemes members' long-term experience across various themes, after they recover from COVID-19. This first piece covers healthcare utilization trends (hospital admission rates), in the months after getting and recovering from COVID-19.
- The other two articles in the series look at the risk of onset of new chronic conditions and long-term mortality outcomes, again after recovering from COVID-19.
Background to our analyses
By 31 May 2022, 18.5% (609,890 members) of Discovery Health administered medical scheme members had experienced a documented COVID-19 infection.
The immediate clinical and financial impact of acute COVID-19 has been well-described in numerous global publications [1,2]. What the local and global scientific community is still documenting is the detail around long-term healthcare utilisation patterns and mortality impact in people who recover from COVID-19. In other words, once people get and recover from COVID-19, how likely are they to experience other health-related events in the future that are related to their having got COVID-19?
- It is important to note that our findings very likely offer a conservative perspective given the likelihood of a high number of undocumented COVID-19 infections in the control, reference population.
Our methodology
For the purposes of this analysis, we considered Discovery Health administered medical scheme member data for the period 1 March 2020 - 30 November 2021.
- 404,067 members were included in the analysis (these individuals had a documented COVID-19 infection determined by a positive PCR test or a healthcare provider's diagnosis).
1) Establishing a test and a control group
We applied a bootstrapping technique to this study cohort in order gain insight into the statistical significance of our findings. Specifically, we randomly selected 404,067 individuals with replacement 500 times to create bootstrap samples of members with an equivalent size to our study cohort size. For each individual who had COVID-19 (test group member), we randomly selected a maximum of 100 potential comparators (clinical comparator) who'd had no documented COVID-19 infection but who had the same underlying health risk factors at two and three months prior to the test group member's COVID-19 infection. We then randomly matched each infected individual to a clinical comparator within each bootstrap without replacement i.e., there was no duplication of control comparators within a bootstrap.
We refer to these pairs of matched infected and uninfected individuals as clinical twins.
2) Why did we look at the period two and three months prior to documented infection date in carrying out our matching?
We went back three months prior to infection for matching, as in the first month prior to the documented infection date, we noted increased healthcare utilisation for the COVID-19 infected individual. Given that the date of documented infection may be several days after the actual clinical infection date, this utilisation was likely attributable to infection, and we wanted to match on patient characteristics independent of utilisation attributable to the acute infection phase. We then specifically selected two time periods - two and three months prior to documented infection date - to ensure that the trend of healthcare utilization patterns in the period prior to infection was consistent between the study population and their matched clinical twins.
This method enabled us to construct a statistical confidence interval around our uninfected population which incorporated both the variability in the demographics of the underlying population being evaluated and the consequent variability of outcomes.
3) The underlying health risk factors we matched on included:
- Age: <1; 1-4; 5-11; 12-18; 19-64 (clinical twins were matched within one year of age of each other); 65+
- Member's sex: Male (M) or Female (F)
- Location: Province in South Africa
- Number of chronic conditions: 0, 1, 2 or more
- Number of prior flu vaccinations: 0, 1, 2 or more. People who had a flu vaccination in the years leading up to and during the COVID-19 pandemic were likely to adhere to preventive health measures and make choices that promote their general health and wellbeing.
- One of five medical scheme product options: Looking at out-of-hospital benefits we divided the 24 plans available through 19 schemes (Discovery Health Medical Scheme and 18 other Discovery Health administered medical schemes), into 5 groups.
- Vaccination status: Having had 'at least one dose' of any COVID-19 vaccine prior to a member's first COVID-19 infection; or 'unvaccinated'
- Diabetes status: Registered on a Chronic Care Benefit (CCB) for this disease; or not registered.
- Hypertension status: Registered on a CCB for this disease; or not registered.
- Ischaemic heart disease status: Registered on a CCB for this disease; or not registered.
- Number of in-hospital admissions in the two and three months prior to COVID-19 infection.
- Probability of an in-hospital admission within the next six months (matched within 2.5% of each other). To work out the probability of an in-hospital admission we used a separate predictive model, which took the following factors into account:
- Chronic conditions a member was registered for
- Demographic factors such as age, sex and type of medical scheme plan the member was on
- The sort of doctors the member had seen in the past 12 months
- Medicines that a member had claimed for in the past 12 months
- Procedures and consultations a member had claimed for in the past 12 months
- ICD10 information from claims submitted in the past 12 months
We compared clinical twins' experiences from the three months before the test group member got COVID-19 and for up to 12 months after the test group member recovered.
- - The test group member's recovery date from COVID-19 was based on either 14-days post a test group member's positive PCR collection date or, where they were admitted to hospital, their discharge date.
4) Matched clinical twin pairs were removed from the analysis from the point of time in the follow up period when:
- Either person withdrew their membership of a Discovery Health administered medical scheme
- Either person died
- The person who got COVID-19 was vaccinated after their infection, or the matched clinical twin was vaccinated (so as not to confound the effects on clinical outcomes).
- The matched clinical twin had a documented COVID-19 infection
- The person who got COVID-19 (test group) had a second documented COVID-19 infection.
5) Admissions were assessed over two periods - in the COVID-19 acute phase (when a person had COVID-19) and recovery phase (the 12 months that followed). What did we measure?
Given that the actual number of admissions vary by member demographics (i.e., by sex, age, number of chronic conditions, and so on), we standardised our analysis by examining the number of admissions per "1,000 life months". This measure looks at the number of hospital admissions per 1,000 members, per month and allows us to compare our results across the different sub-cohorts. Given that the duration of period zero is not standardized at a month (the time frame ranges from a minimum of two weeks for people who didn't go to hospital, to a maximum two weeks after discharge for those who were admitted), we refer to the 'number of hospital admissions per 1,000 infections' during the acute period of infection (period 0).
We looked at:
- Admissions risk: How much higher is the risk of going to hospital once people have had and recovered from COVID-19, compared to a matched clinical twin (who didn't get COVD-19)? We worked this out as:

A result, or ratio <1 means that in the months after people get and recover from COVID-19, there's a higher admission rate in the COVID-19 study population relative to the non-COVID19 population. Where the relative risk ratio is <1, the opposite is true.
Definitions:
- Number of admissions: The absolute number of admissions in the group that got COVID-19 per 1,000 infections or life months, over a particular period.
- Excess admissions: The number of hospital admissions in the COVID-19 population that were over and above the number of admissions in the non-COVID-19 population, per 1,000 infections or life months. The higher the number of excess admissions, the more that people in the COVID-19 population went to hospital in the period of infection and up to twelve months thereafter, than did the general population.
We worked this out as:

We assessed the statistical significance of our findings to confirm that the differences we saw were unlikely to be due to underlying population variability alone.
Excess admissions were compared against those of their matched clinical twin. If the 95% confidence interval of the difference in outcomes did not cross zero (i.e., no difference observed), we considered them to have a statistically significant higher outcome rate.
In the time after recovery from COVID-19, the average admission risk, average number of admissions and average excess admissions were weighted by total exposure (the changing number of matched clinical twins over time) in order to account for the decreasing number of clinical twins under observation over time.
6) What types of hospital admissions did we look at? 'All-cause admissions' and 'Medical admissions'
First, we looked at 'all-cause' admissions or 'overall admissions' - this meant all admissions so included those possibly related to COVID-19 complications and others.
Then we narrowed down our focus by looking at what we call 'medical admissions' - admissions that were possibly related to COVID-19. We did this by excluding those that were unlikely to be related to COVID-19 such as admissions that required time in an operating theatre (like traumas, elective surgeries, obstetric cases, mental health - excluding depression - cases and admissions for eye conditions). Remaining admissions were considered 'medical admissions', possibly related to COVID-19.
Our medical admissions were then further assessed by looking at:
- Member's sex: Male (M) or Female (F)
- Number of chronic conditions: none, 1 to 2, or 3
- Ages: Brackets looked at were <1, 1-4, 5-11, 12-18, 19-39, 40-49, 50-59, 60-69, 70-79 and 80+
- Likely COVID-19 variant contracted, based on when people got COVID-19 and which wave of infection the country was in at the time. Variant options were D614G (wave 1), Beta (wave 2) or Delta (Wave 3).
- Vaccination status: Unvaccinated or fully vaccinated. Fully vaccinated individuals were those who'd had a COVID-19 infection at least 14 days after dose two of any COVID-19 vaccine. South Africa's first phase of COVID-19 vaccination (17 February to 15 April) focused on healthcare workers. It was on 16 April that vaccination opened up to essential workers and the elderly. Most members of the public only became eligible for and accessed COVID-19 vaccines later in the year, so we have only five months of follow-up data for medical scheme members who were fully vaccinated before their first COVID-19 infection.
- How serious the admission was: Members were assigned to a group according to the most serious phase of their admission. These included Ventilation (considered most serious or 'highest acuity'), Care in ICU, High Care or a General ward or Not hospitalized.
Findings: match quality and number of clinical twin observations over time
Overall, we were able to find potential twin matches for 88.8% (n = 358,887) of our COVID-19 test group cohort.Younger, healthier people had a bigger chance of a potential match. After completing the matching process, our analysis included 80.2% of medical admissions, 77.3% of deaths recorded, and 86.2% of people aged 65 and over (Table 1).
| Cohort | Total number of clients | Matched | Average % of total medical admissions included in our cohort after matching | Average % of deaths included our cohort after matching | Average % of people aged 65 and over, who were matched | |
| Average number of clients across 500 bootstraps | % of total | % | % | % | ||
| Overall | 404,067 | 358,887 | 88.8 | 80.2 | 77.3 | 86.2 |
| Sex | ||||||
| Female | 216,659 | 223,715 | 88.0 | 80.2 | 78.3 | 88.0 |
| Male | 185,696 | 190,312 | 88.2 | 80.6 | 76.9 | 84.3 |
| Number of Chronic Conditions | ||||||
| None | 255,528 | 243,216 | 95.2 | 94.0 | 92.2 | 93.2 |
| One to Two | 105,700 | 84,456 | 79.9 | 76.7 | 78.1 | 88.4 |
| Three or More | 43,469 | 29,038 | 66.8 | 66.6 | 69.5 | 82.2 |
| Age bands | ||||||
| <1 | 303 | 281 | 92.8 | 89.0 | ||
| 1-4 | 4,777 | 4,600 | 96.3 | 94.8 | 58.5 | |
| 5-11 | 12,570 | 12,249 | 97.5 | 90.7 | 100.0 | |
| 12-18 | 24,463 | 23,697 | 96.9 | 89.9 | 75.5 | |
| 19-39 | 157,346 | 142,645 | 90.7 | 84.6 | 79.8 | |
| 40-49 | 85,972 | 75,353 | 87.7 | 81.3 | 76.6 | |
| 50-59 | 60,810 | 49,627 | 81.6 | 76.3 | 71.3 | |
| 60-69 | 32,474 | 25,897 | 79.8 | 75.9 | 73.5 | |
| 70-79 | 17,186 | 14,782 | 86.0 | 83.4 | 81.8 | |
| 80+ | 7,552 | 6,482 | 85.8 | 84.2 | 84.1 | |
| Circulating COVID-19 Variant | ||||||
| D614G | 86,825 | 77,648 | 89.4 | 84.2 | 84.8 | 90.0 |
| Beta | 104,089 | 86,734 | 83.3 | 75.6 | 70.3 | 81.4 |
| Delta | 214,852 | 193,267 | 90.0 | 82.5 | 80.2 | 87.9 |
| Vaccination status | ||||||
| Un-vaccinated | 367,487 | 323,615 | 88.1 | 80.4 | 77.1 | 85.4 |
| Fully vaccinated | 3,982 | 3,568 | 89.6 | 82.8 | 80.0 | 90.0 |
| Highest acuity | ||||||
| Hospitalized: Ventilation | 5,693 | 4,546 | 79.9 | 79.9 | 79.9 | 85.9 |
| Hospitalized: ICU | 8,729 | 6,852 | 78.5 | 78.7 | 77.0 | 83.3 |
| Hospitalized: High Care | 9,014 | 7,318 | 81.2 | 81.3 | 78.4 | 85.8 |
| Hospitalized: General Ward | 46,255 | 37,666 | 81.4 | 80.8 | 75.5 | 83.7 |
| Not hospitalized | 344,243 | 306,825 | 89.1 | 77.4 | 79.5 | 88.2 |
Table 1. Categories considered in our analysis of Discovery Health administered medical scheme members who had a documented COVID-19 infection and who were matched to a clinical twin (1 March 2020 - 30 November 2021).
An overall 88.8% match rate resulted in a mean of 358,887 [95% CI: 358259, 359516] members per bootstrap in the infection period. Keep in mind that we removed clinical twins from our analysis where there were scheme withdrawals, deaths, new infections, re-infections, or COVID-19 vaccinations in the post-infection or follow up period.
In the follow-up period, we experienced a steady decrease in the number of members under observation - from a high of 305,535 [95% CI: 304870, 306202] members in month one since recovery to 33,512 [95% CI: 33178, 33846] members at 12 months post recovery (Figure 1).
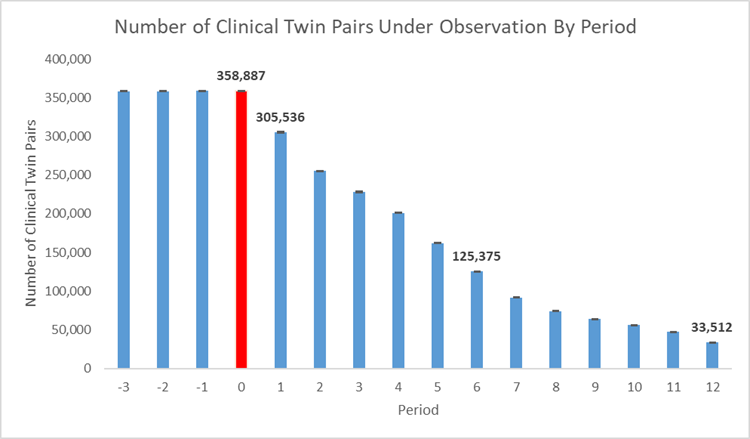
Figure 1. Number of clinical twins under observation over time where red (period 0) shows the acute infection period.
Findings: 1a) Overall or all-cause admission rates - all admissions, so both those possibly related to COVID-19 and those unrelated
In the two to three months before our test group members were infected with COVID-19, there was no observed statistical difference between our test and control populations, showing they were well-matched.
When people in the test group had COVID-19 (infection period - or 'period zero') their admission rate increased significantly. In the recovery phase (two to 12 months after their infection) their admission rate decreased, but it was still higher than the admission rate seen in uninfected, matched clinical twins (see Figure 2a).
Specifically, we observe an increased admission risk in the period up to 12 months' post COVID-19 recovery.
We see (Figure 2a):
- A 16.5x higher admission risk during the infection
- A 1.8x higher admission risk one month post recovery
- A 1.2x higher weighted average admission risk two to 12 months post recovery
- 158.2 admissions per 1,000 infections during the period of infection (y-axis)
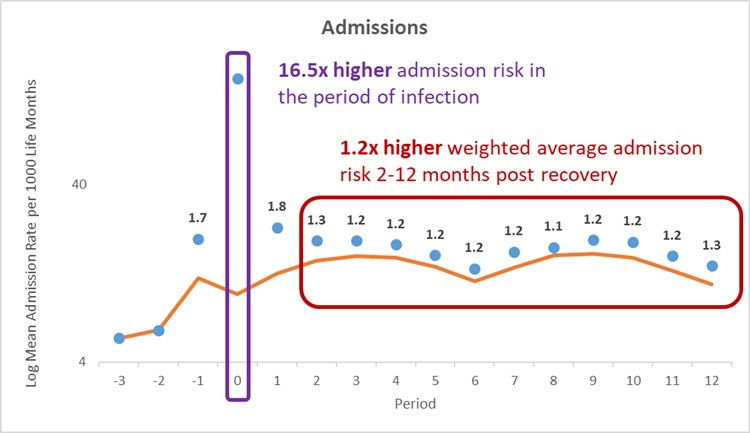
Figure 2a: All-cause admission rate per 1,000 life months for the COVID-19 population and comparator population over time. Blue - mean of COVID-19 infected members. Orange - mean of uninfected individuals.
Importantly, for the full 12 months post-infection, we observe that those with a documented infection have an admission rate both above the uninfected average admission rate and their own admission rate prior to infection.
This excess utilization resulted in:
- An average of 148.6 additional admissions per 1,000 infections during the COVID-19 episode
- A weighted average of 3.1 additional admissions per 1,000 life months in each of the two to 12 months post recovery (Figure 2b).
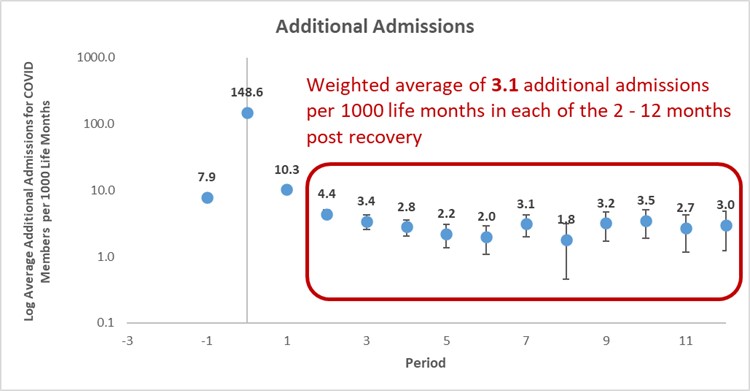
Figure 2b: Average number of additional all-cause admissions for COVID-19 members per 1,000 life months
1b) All-cause admissions: respiratory symptoms account for most admissions when people get COVID-19
When they had COVID-19 (what we call the 'acute COVID-19 phase'), most admissions (76.3%) were related to the respiratory system. One month post recovery, respiratory system-related admissions dropped to account for 7.8% of all admissions, before decreasing to an average of 3.2% in the two to 12 months post recovery (Figure 3).
1c) All-cause admissions: Why were medical scheme members admitted in the 12 months that followed their recovery
In the 12-month period after members had COVID-19 (what we call the 'recovery period'), we saw hospital admissions for the following:
- 21% for pregnancy, childbirth, and the puerperium - Caesarean delivery made up 54% of this chapter.
- 16% for musculoskeletal system and connective tissue conditions, with medical back problems making up 12% of this chapter
- 13% for digestive system conditions, with anal procedures making up 12% of this chapter
- 7% for circulatory system conditions4, with cardiac catheterization for ischaemic heart disease at 16% of this chapter
- 7% for female reproductive system conditions, with uterine and adnexa procedures for cancers in situ and non-malignant (i.e., not spreading) making up 50% of this chapter.
All-cause admissions for medical, surgical and obstetric reasons may or may not be directly related to a member having contracted and recovered from COVID-19. Therefore, we further restricted analysis to 'medical admissions' as defined above, thereby excluding those most unlikely to be related to COVID-19.
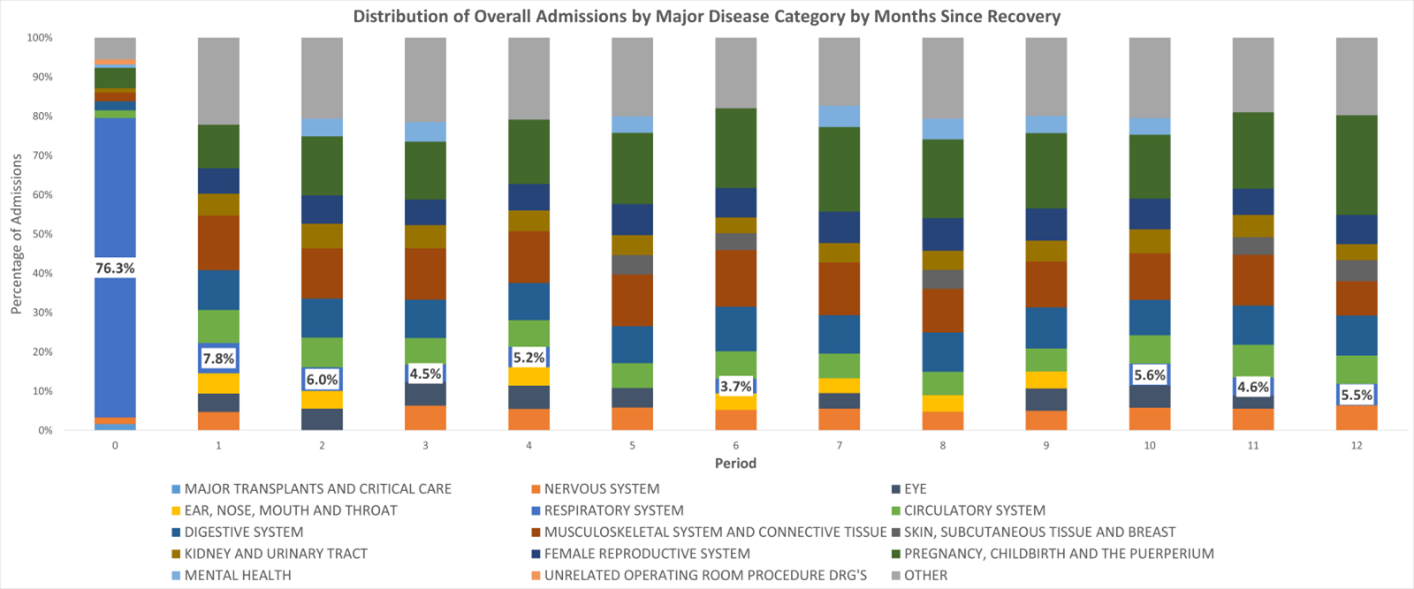
Figure 3: Risk of admission according to the type of condition members experience after their acute COVID-19 infection period (Month zero).
Findings: 2a) Medical admissions (restricting our analysis to admissions possibly related to COVID-19 complications)
We observe an increased medical admission risk up to 12 months post COVID-19 recovery.
We see (Figure 4a):
- A 45.8x higher medical admission risk during the infection phase
- A 2.4x higher medical admission risk one month post recovery
- A 1.4x higher weighted average medical admission risk two to 12 months post recovery
- 132.9 medical admissions per 1,000 infections during the period of infection (y-axis)
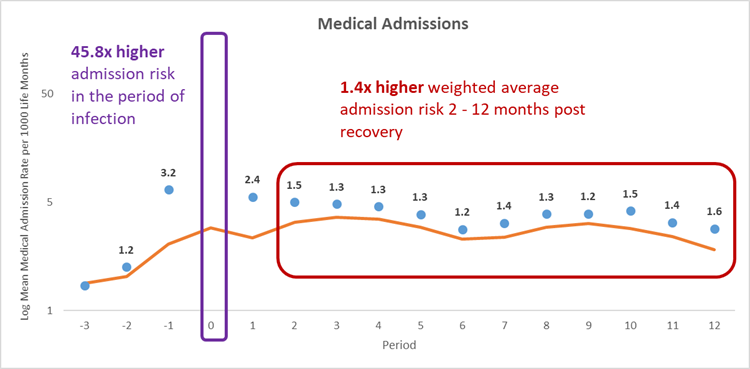
Figure 4a) Medical admission rate per 1,000 life months for the COVID-19 population and comparator population over time. Blue - mean of COVID-19 infected members. Orange - mean of uninfected individuals.
This excess utilization resulted in (Figure 4b):
- An average of 130.0 additional medical admissions per 1,000 infections during the COVID-19 episode
- 3.3 additional medical admissions per 1,000 life months one month post recovery
- A weighted average of 1.1 additional medical admissions per 1,000 life months in each of the two to 12 months post recovery
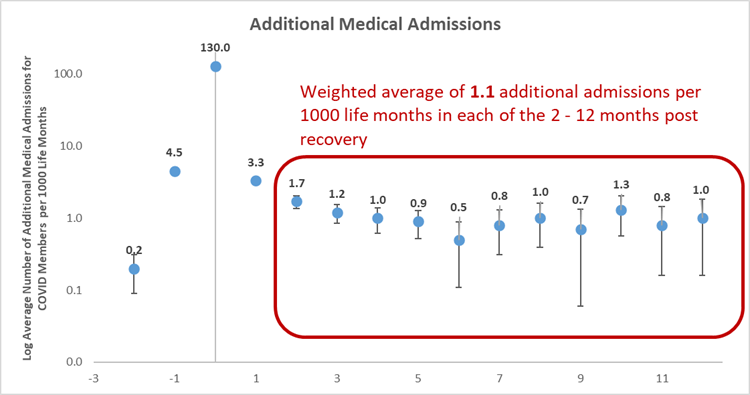
Figure 4b) Average number of additional medical admissions for COVID-19 members per 1,000 life months
Next, we extracted insights from various clinical twin sub-cohorts.
2b) What sort of medical admissions did medical scheme members experience in the 12 months that followed their recovery?
In the 12-month period after members had COVID-19 (so, in their 'recovery period'), we saw medical admissions at:
- 29% for circulatory system conditions, with cardiac catheterization for ischaemic heart disease making up 19% of this chapter
- 24% for respiratory system conditions, with simple pneumonia and whooping cough making up 30% of this chapter
- 16% for nervous system conditions, with seizures making up 34% of this chapter
- 15% for mental health conditions4, with depression at 100% of this chapter
- 7% for kidney and urinary tract conditions, with kidney and urinary tract infections making up 51% of this chapter.
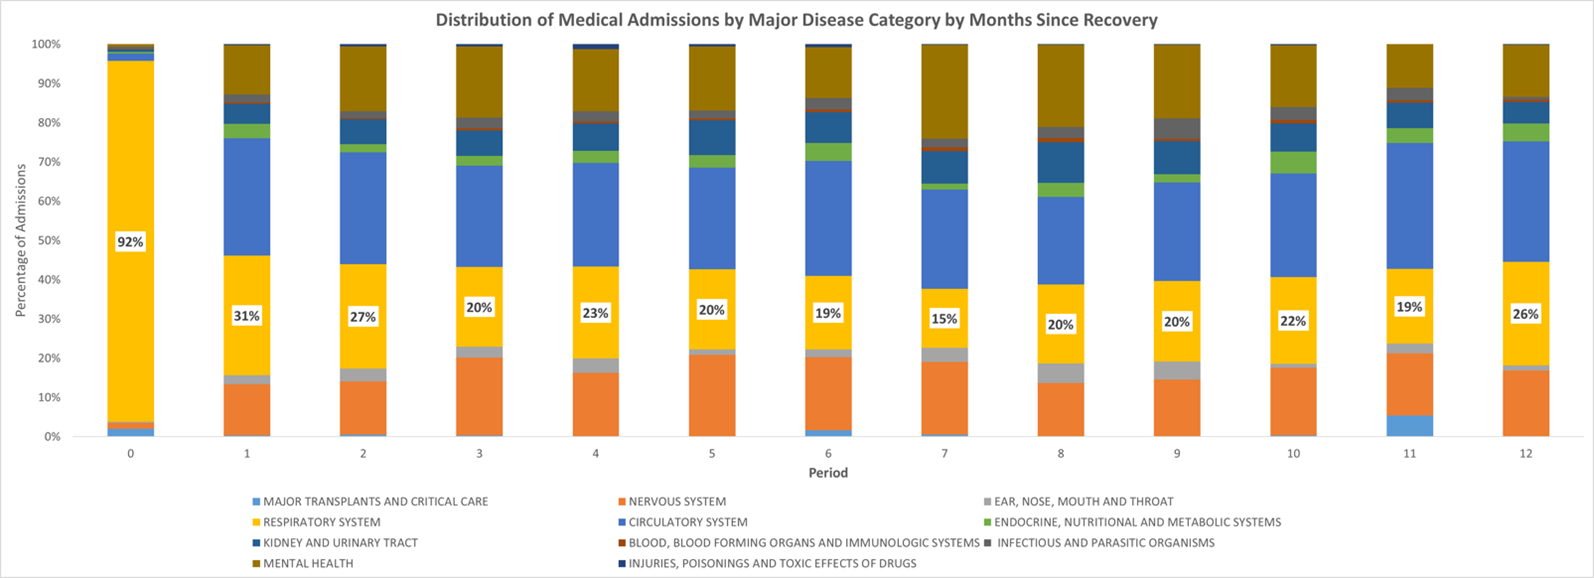
Figure 5: Risk of medical admission according to the type of condition members experience after their acute COVID-19 infection period (Month zero).
2c) Are there medical admission-related differences in men and women - compared to their clinical twins?
Table 2 shows:
a) In the infection period:
Compared to their clinical twins, men experience a higher relative and absolute medical admission risk than women. Men who get COVID-19 have a 49 times higher risk of medical admission compared to their clinical twins who didn't get COVID-19. They also experience 155 additional medical admissions per 1000 infections.
b) In the (post-infection) recovery period:
Women experience a higher relative risk of admission to hospital for a longer time (10 months compared to 5 months for males), and both men and women experience 1 additional medical admission per 1 000 life months post recovery.
| Sex | Period of Infection | Recovery period | |||||
| Medical admission risk | Number of medical admissions per 1,000 infections for the COVID-19 population | Number of excess medical admissions per 1,000 infections | Number of significant months (NSM) post recovery | Weighted average times higher medical admission risk until NSM | Weighted average number of medical admissions per 1,000 life months until NSM for COVID-19 population | Weighted average additional medical admissions per 1,000 life months in each of the NSM | |
| Women | 42.4 | 110.7 | 108.1 | 10 | 1.4 | 4.3 | 1.2 |
| Men | 49.2 | 158.8 | 155.5 | 5 | 1.3 | 4.6 | 1.2 |
Table 2. Summary of medical admission risk for men and women. Highlighted areas indicate the highest risk by sex.
2d) What's the impact of living with chronic conditions on medical admission risk?
Table 3 shows:
a) In the infection period:
Medical scheme members who have no chronic conditions experience a 61 times higher relative medical admission risk than their clinical twins.
Members who have three or more chronic conditions experience a 34 times higher relative medical admission risk and a higher absolute medical admission risk (looking at actual number of admissions) - 398 medical admissions per 1000 infections.
b) In the (post-infection) recovery period:
Members with no chronic conditions experience a higher relative risk of admission for 10 months (compared to their clinical twin) - longer than people with three or more chronic conditions do, as they experience a higher risk for four months (compared to their clinical twin).
Members with three or more chronic conditions experience a higher absolute increased risk - an additional 5 medical admissions per 1000 infections.
| Number of Chronic Conditions | Period of Infection | Recovery period | |||||
| Medical admission risk | Number of medical admissions per 1,000 infections for the COVID-19 population | Number of excess medical admissions per 1,000 infections | Number of significant months (NSM) | Weighted average times higher medical admission risk until NSM | Weighted average number of medical admissions per 1,000 life months until NSM for COVID-19 population | Weighted average additional medical admissions per 1,000 life months in each of the NSM | |
| None | 60.5 | 86.7 | 85.2 | 10 | 1.5 | 2.7 | 0.9 |
| One to Two | 43.9 | 176.7 | 172.6 | 5 | 1.4 | 6.4 | 1.6 |
| Three or More | 33.6 | 398.2 | 386.3 | 4 | 1.3 | 17.6 | 4.8 |
Table 3. Summary of medical admission risk by members' chronic condition count. Highlighted areas indicate the highest risk by number of chronic conditions.
2e) What is the impact of age on medical admission risk?
Table 4 shows:
a) In the infection period:
Compared to their clinical twins, during the infection period, members aged 5 to 11 experienced the highest - 53 times higher - relative medical admission risk.
Older members (aged 80+) experienced the highest absolute medical admission risk (560 per 1000 infections).
b) In the post-infection (recovery) period:
There is no evidence of increased medical admission risk for members less than 12 years of age.
Members aged 12 to 18 experienced the highest risk of admission (1.9 times increased risk) relative to clinical twins/members with no infection of the same age.
Members aged 40-59 experienced increased risk of admission for the greatest number of months after infection with COVID-19.
Older members experienced a higher increased absolute risk of admission post recovery - individuals aged 80 and over experienced nine additional medical admissions per 1000 life months.
| Age Group | Period of Infection | Recovery period | |||||
| Medical admission risk | Number of medical admissions per 1,000 infections for the COVID-19 population | Number of excess medical admissions per 1,000 infections | Number of significant months (NSM) | Weighted average times higher medical admission risk until NSM | Weighted average number of medical admissions per 1,000 life months until NSM for COVID-19 population | Weighted average additional medical admissions per 1,000 life months in each of the NSM | |
| <1 | 40.1 | 185.5 | 181.0 | - | - | - | - |
| 1-4 | 47.9 | 116.6 | 113.9 | 1. | - | - | - |
| 5-11 | 53.4 | 24.6 | 24.0 | 1. | - | - | - |
| 12-18 | 27.9 | 19.1 | 18.4 | 2 | 1.9 | 3.0 | 1.4 |
| 19-39 | 45.5 | 57.6 | 56.3 | 3 | 1.3 | 2.8 | 0.7 |
| 40-49 | 52.0 | 128.5 | 126.1 | 5 | 1.5 | 3.9 | 1.3 |
| 50-59 | 51.2 | 204.0 | 200.0 | 5 | 1.5 | 5.6 | 1.8 |
| 60-69 | 45.8 | 301.9 | 295.2 | 3 | 1.5 | 10.2 | 3.1 |
| 70-79 | 39.2 | 448.1 | 436.6 | 2 | 1.6 | 18.1 | 6.5 |
| 80+ | 43.2 | 559.8 | 546.6 | 3 | 1.7 | 21.8 | 8.7 |
Table 4. Summary of medical admission risk by members' age. Highlighted areas indicate the highest risk by age group.
2f) What is the impact of the COVID-19 variant contracted on medical admission risk?
Table 5 shows:
In the infection period:
Members who contracted the Beta variant (which drove South Africa's second wave of infection) experienced the highest medical admissions risk (a 64 times higher relative risk of admission) and the highest absolute medical admission risk (172 medical admissions per 1000 infections), again compared to matched clinical twins (who had no COVID-19 infection).
In the post-infection (recovery) period:
Members who contracted the Beta variant experienced the greatest relative admission risk (1.6 times higher risk vs those with no infection).
Members who contracted the D614G variant (which drove South Africa's first wave of infection) experienced increased risk of admission for the greatest number of months. This is likely due to members who contracted D614G having the longest follow-up time as they contracted COVID-19 before members who were infected in South Africa's Beta-driven second wave of infection and Delta-driven third wave of infection.
Across all variants, the number of additional medical admissions per 1000 life months post recovery is consistent (at between 1.4 and 1.5).
| Circulating COVID-19 Variant | Period of Infection | Recovery period | |||||
| Medical admission risk | Number of medical admissions per 1,000 infections for the COVID-19 population | Number of excess medical admissions per 1,000 infections | Number of significant months (NSM) | Weighted average times higher medical admission risk until NSM | Weighted average number of medical admissions per 1,000 life months until NSM for COVID-19 population | Weighted average additional medical admissions per 1,000 life months in each of the NSM | |
| D614G | 50.5 | 143.7 | 140.9 | 12 | 1.5 | 4.5 | 1.4 |
| Beta | 63.5 | 171.5 | 168.8 | 7 | 1.6 | 4.1 | 1.5 |
| Delta | 38.6 | 116.3 | 113.3 | 10 | 1.5 | 5.1 | 1.5 |
Table 5. Summary of medical admission risk by members' COVID-19 variant. Highlighted areas indicate the highest risk by circulating COVID-19 variant.
2g) What is the impact of vaccination status on admission risk?
Table 6 shows that:
In the infection period:
Members who were unvaccinated before they got COVID-19 experienced a higher relative (47 times higher risk of admission for the unvaccinated compared to 20 for the vaccinated) and absolute medical admission risk of admission compared to those who were vaccinated (136 admissions compared to 56 admission).
In the recovery (post-infection) period:
There is no evidence of increased medical admission risk for members who were fully vaccinated prior to their COVID-19 infection.
For those who were unvaccinated at the time of their infection there is a 1.4 times higher long-term medical admission risk (in the two to twelve months after infection), translating to one additional admission per 1000 life months for up to 12 months post recovery.
| Vaccination Status | Period of Infection | Recovery period | |||||
| Medical admission risk | Number of medical admissions per 1,000 infections for the COVID-19 population | Number of excess medical admissions per 1,000 infections | Number of significant months (NSM) | Weighted average times higher medical admission risk until NSM | Weighted average number of medical admissions per 1,000 life months until NSM for COVID-19 population | Weighted average additional medical admissions per 1,000 life months in each of the NSM | |
| Un-vaccinated | 47.1 | 135.8 | 132.9 | 12 | 1.4 | 4.0 | 1.1 |
| Fully vaccinated | 20.0 | 56.1 | 53.1 | - | - | - | - |
Table 6. Summary of medical admission risk by members' vaccination status. Highlighted areas indicate the highest risk by vaccination status.
Where people went to hospital for COVID-19, what was the impact of the ward acuity (seriousness) of their admission on post-infection admission risk?
We looked at the acuity of admission or the seriousness of an admission, by looking at the medical experience or type of ward members were admitted to when they went to hospital for COVID-19 treatment in the month when they got the disease.
Here, the highest acuity admission was where the patient required ventilation. The lowest was an admission to a general ward throughout the patient's stay.
Table 7 shows:
Overall, members who were ventilated experience the highest relative and absolute increase in medical admission risk in the recovery period - 6.0 times higher long term medical admission risk, translating to 17 additional admissions per 1000 life months for up to three months post recovery.
Members with the lowest ward acuity experience (general ward admission) when they had COVID-19 experienced an increased medical admission risk for the longest period - 12 months after their recovery.
Members who got COVID-19 but didn't need to go to hospital experienced the lowest additional medical admissions per 1000 life months post recovery.
These results are consistent with a prior study done by our team, showing that those members of Discovery Health administered medical schemes who reported multiple long-term COVID-19 symptoms, were more likely to be people who'd had an ICU admission when they had COVID-19.
| Highest Acuity | Period of Infection | Post recovery | |||||
| Medical admission risk | Number of medical admissions per 1,000 infections for the COVID-19 population | Number of excess medical admissions per 1,000 infections | Number of significant months (NSM) | Weighted average times higher medical admission risk until NSM | Weighted average number of medical admissions per 1,000 life months until NSM for COVID-19 population | Weighted average additional medical admissions per 1,000 life months in each of the NSM | |
| Hospitalized: Ventilation | - | - | - | 3 | 6.1 | 21.4 | 16.8 |
| Hospitalized: ICU | - | - | - | 5 | 4.0 | 20.8 | 14.8 |
| Hospitalized: High Care | - | - | - | 7 | 2.9 | 16.4 | 10.4 |
| Hospitalized: General Ward | - | - | - | 12 | 2.2 | 10.7 | 5.7 |
| Not hospitalized | - | - | - | 5 | 1.2 | 3.8 | 0.7 |
Table 7. Summary of medical admission risk by members' highest acuity during their period of infection. Highlighted areas indicate the highest risk by highest acuity.
Conclusion
In this, the first of three post-COVID impact analyses in our series, we have considered the risk of hospital admission up to 12 months post a COVID-19 infection.
- Our study period spanned 1 March 2020 - 30 November 2021.
- Of 404,067 members initially included in the analysis (these individuals had a documented COVID-19 infection determined by a positive PCR test or a provider diagnosis) 358,887 were matched to a clinical twin.
We considered the influence of the following on the risk of admission:
- Sex
- Number of chronic conditions a medical scheme member lives with
- Age
- Likely COVID-19 variant contracted
- Vaccination status
- Where members went to hospital when they had COVID-19, at the seriousness of the admission and how this impacted long-term admission risk.
We found that medical admission risk (this refers to admissions possibly related to COVID-19 complications) varied according to the lenses listed above.
We found the highest relative long-term admission risk (up to ten months' post recovery) was for those with lowest admission risk during the period of infection, i.e., higher relative risk ratios post-infection for:
- Women
- Members with no chronic conditions
- Medical scheme members aged 12-18
Furthermore:
- Long term admission risk post-recovery from COVID-19 varied slightly by viral variant, but we saw sustained long term admission risk observed for all three variants considered - the D614G, Beta and Delta variants which drove South Africa's first, second and third waves of infection, respectively.
- Admission risk further varied by vaccination status. We saw sustained long term admission risk for up to 12 months' post infection for unvaccinated members, whilst there is no evidence of increased risk two months post the acute phase in fully vaccinated members.
- Post-recovery admission risk varies by severity of admission. We see the highest absolute and relative risk of admission in the months after recovery from COVID-19 for members who required ventilation, followed by members with an ICU, high care or general ward admission (in descending order of elevated risk, respectively). Members who had a documented COVID-19 infection but who didn't need admission to hospital while they were sick, had the lowest level of elevated risk post recovery.
Evidence on the risk people face long-term post-COVID recovery continues to emerge on a local and global scale. The additional two articles in our three-part series will add to the picture we've begun to build on in this first article.
- Authors of this article note that the above findings are representative of our medical scheme member population mix, and the long-term patterns observed may be different in other populations and in different clinical settings. It is also important to note this data analysis considers claims data (i.e., claims submitted for members of medical schemes administered by Discovery Health).
Acknowledgements
We would like to thank Discovery Health's Business Intelligence and Big Data Administration teams for the data assets and substantial computational power made available to facilitate our work on this study, as well as Discovery Health's Clinical Coding Intelligence team.
References
- Graves JA, Baig K, Buntin M. The Financial Effects and Consequences of COVID-19: A Gathering Storm. JAMA. 2021;326(19):1909-1910. doi:10.1001/jama.2021.18863
- Bang JY, Hawes R, Varadarajulu S. Clinical, financial and academic implications of COVID-19 on a tertiary care interventional endoscopy programme. Gut 2021; 70:1431-1434.
- Kaye AD, Okeagu CN, Pham AD, et al. Economic impact of COVID-19 pandemic on healthcare facilities and systems: International perspectives. Best Pract Res Clin Anaesthesiol. 2021;35(3):293-306. doi: 10.1016/j.bpa.2020.11.009
- Yan Xie, Evan Xu, Benjamin Bowe and Ziyad Al-Aly Long-term cardiovascular outcomes of COVID-19. Nature Medicine volume 28, pages583-590 (2022).
Interested in knowing more or reporting on these findings?
Please contact us on MEDIA_RELATIONS_TEAM@discovery.co.za to request any updated data available since publication and any further context required.
Did you find this post useful?
Read our related posts, the second and third article in this three-part series in which we consider post-COVID risk of mortality and chronic illness registration - with analysis for three months prior to and up to 12 months post infection.
Read our related post (not part of this three-part Long COVID utilisation series) titled "Long COVID symptoms, impact on carrying out daily activities: Survey of just over 7,000 medical scheme members reveals key insights." We find that an alarmingly high number of medical scheme members have protracted COVID-19 symptoms (long COVID), often with disruption to daily living. The risk of these events is higher in women, in those admitted to hospital or ICU for COVID-19, and those with high morbidity and pre-existing chronic illness. Being COVID-19 vaccinated and regular physical activity lower this risk.
Disclaimer
All information shared on this page is based on perspectives gained from analysis of figures and trends emanating from Discovery Health's data pool. The analysis, which is conducted by Discovery Health's actuarial and data scientist team, aims to encourage industry dialogue. This content is shared for educational and informational purposes only. It does not constitute peer-reviewed, published scientific research, and hence should not be interpreted as such or used as a basis for altering treatment decisions.

15 min read
Deep dive: Admission rates across South Africa's four COVID-19 waves confirm Omicron-driven fourth wave's lower severity, and more.
07 July 2022
Authors: Chana Suttner (Actuary, Discovery Health),Michael Cohen (Actuarial Analyst, Discovery Health), Shirley Collie (Chief Healthcare Analytics Actuary, Discovery Health

13 min read
Long COVID symptoms, impact on carrying out daily activities: Survey of just over 7,000 medical scheme members reveals key insights
16 June 2022
Authors: Shirley Collie (Chief Healthcare Analytics Actuary, Discovery Health), Lizelle Steenkamp (Senior Healthcare Statistician, Discovery Health), Lebohang Radebe (Data Scientist, Discovery Health), Dr Smybinn Mathews (Clinician, Discovery Health) and Dr Dave Jacobs (Senior Clinician and Clinical Classification System Architect, Discovery Health)

13 min read
Discovery's COVID-19 personal resilience index predicts an individual's resilience to serious COVID-19 illness
23 May 2022
Authors: Lizelle Steenkamp (Senior Healthcare Statistician at Discovery Health), Tommy Chen (Actuary at Discovery Health), Jared Champion (Senior Actuary at Discovery Health) and Donald Ntjana (Senior Data Scientist at Discovery Health)