8-year review of patient satisfaction surveys: Medical scheme members who score initial hospital stay poorly, more likely to have unplanned readmission

Survey responses from patients discharged from hospital and readmitted (unplanned) within 30 days provide fascinating insights into possible avenues through which to address perceived hospital care gaps.
Authors
Discovery Health's Lizelle Steenkamp (Senior Healthcare Statistician), Sian-Ailin Da Silva (Statistician) and Shirley Collie (Chief Research Actuary).
Analysing patient satisfaction scores among Discovery Health Medical Scheme members
Globally, unplanned hospital readmission (soon after a first admission) rates can be an important indicator of quality of care provided to patients. Not all unplanned readmissions are a result of poor quality of care, as certain complications can't be avoided. However, some unplanned readmissions are avoidable (for example, some research suggests that around 25%1,2 of readmissions are avoidable3).
High or unexpected, unplanned readmission rates indicate potential gaps in the care provided to patients during their first admission. If patients are being readmitted, on an unplanned basis, shortly after discharge, this suggests that their initial treatment or follow-up care may have been inadequate4.
Also, unplanned readmissions can negatively impact the patient care experience as they may feel frustrated, confused, or dissatisfied if they must return to the hospital shortly after being discharged and are not expecting to be.
Analysing patient satisfaction scores among Discovery Health Medical Scheme members
In this report, we investigate patient satisfaction scores for Discovery Health Medical Scheme (DHMS) members who were admitted to hospital - some of whom had to be admitted again, on an unplanned basis, shortly after their first admission.
Using those scores, we determined how patients who had a subsequent unplanned readmission perceived the quality of hospital care they received when first admitted, and compare their care scores to those of patients who did not have an unplanned readmission.
Based on this data, and the responses received to individual questions in the survey, we made inferences about where there may be perceived gaps in care.
This exercise opens up opportunities to address perceived gaps in care, ultimately to allow for better hospital experiences for DHMS members and, by extension, for the general public using the private hospitals included in our analysis.
What is an unplanned readmission?
We define an unplanned readmission as an admission (to a private acute hospital) that happens within 30 days of the patient being discharged from their index admission.
Unplanned readmission rates were calculated as a percentage of all hospital admissions in a given year.
We excluded the following from our analysis:
- Admissions for DHMS members under the age of 18
- Mental health-related admissions
- Oncology-related admissions
- Caesarean sections or vaginal delivery index admissions
- Planned5 readmissions (to avoid counting intended readmissions e.g. for obstetrical delivery, transplant surgery, maintenance chemotherapy etc.)
- Index admissions where the patient withdrew from the scheme within 30 days after discharge
- Index admissions where the patient passed away.
Patients who didn't need an unplanned readmission report a better initial hospital experience
Since 2010, Discovery Health has measured how satisfied administered medical scheme members (including DHMS members) are during their hospital stays. This is done through a tool called the 'Member Experience Survey'.
DHMS members are sent this survey seven days after they are discharged from their index admission.
From 2015 to 2022, the average survey response rate among DHMS members who have experienced an unplanned readmission has been 6.4%, compared to an 11.7% response rate among members who have not been readmitted. So DHMS members are less likely to respond to the survey when they have had to be readmitted on an unplanned basis.
- We analysed members' overall ratings of their hospital stay.
- A rating of '0' indicated the worst possible hospital stay, and '10' the best possible hospital stay.
- A top box rating (the most positive responses out of a set of responses) was calculated for each group (index admissions with a subsequent readmission versus index admissions without a subsequent readmission). We looked at how many members scored the facility a 9 or 10 among all respondents.
- Patients without a readmission rated their in-hospital experience higher than patients who experienced a readmission.
In 2022, the overall average top box satisfaction score for members who didn't experience an unplanned readmission was 60%, and 46% for members who were readmitted.
Over the eight-year study period, overall patient satisfaction scores improved, in both groups.
The top box score increased by a greater margin for patients who didn't experience an unplanned readmission - by 20% (from 49% in 2015 to 60% in 2022), compared to 14% (from 41% in 2015 to 46% in 2022) for patients who had an unplanned readmission (Figure 1).
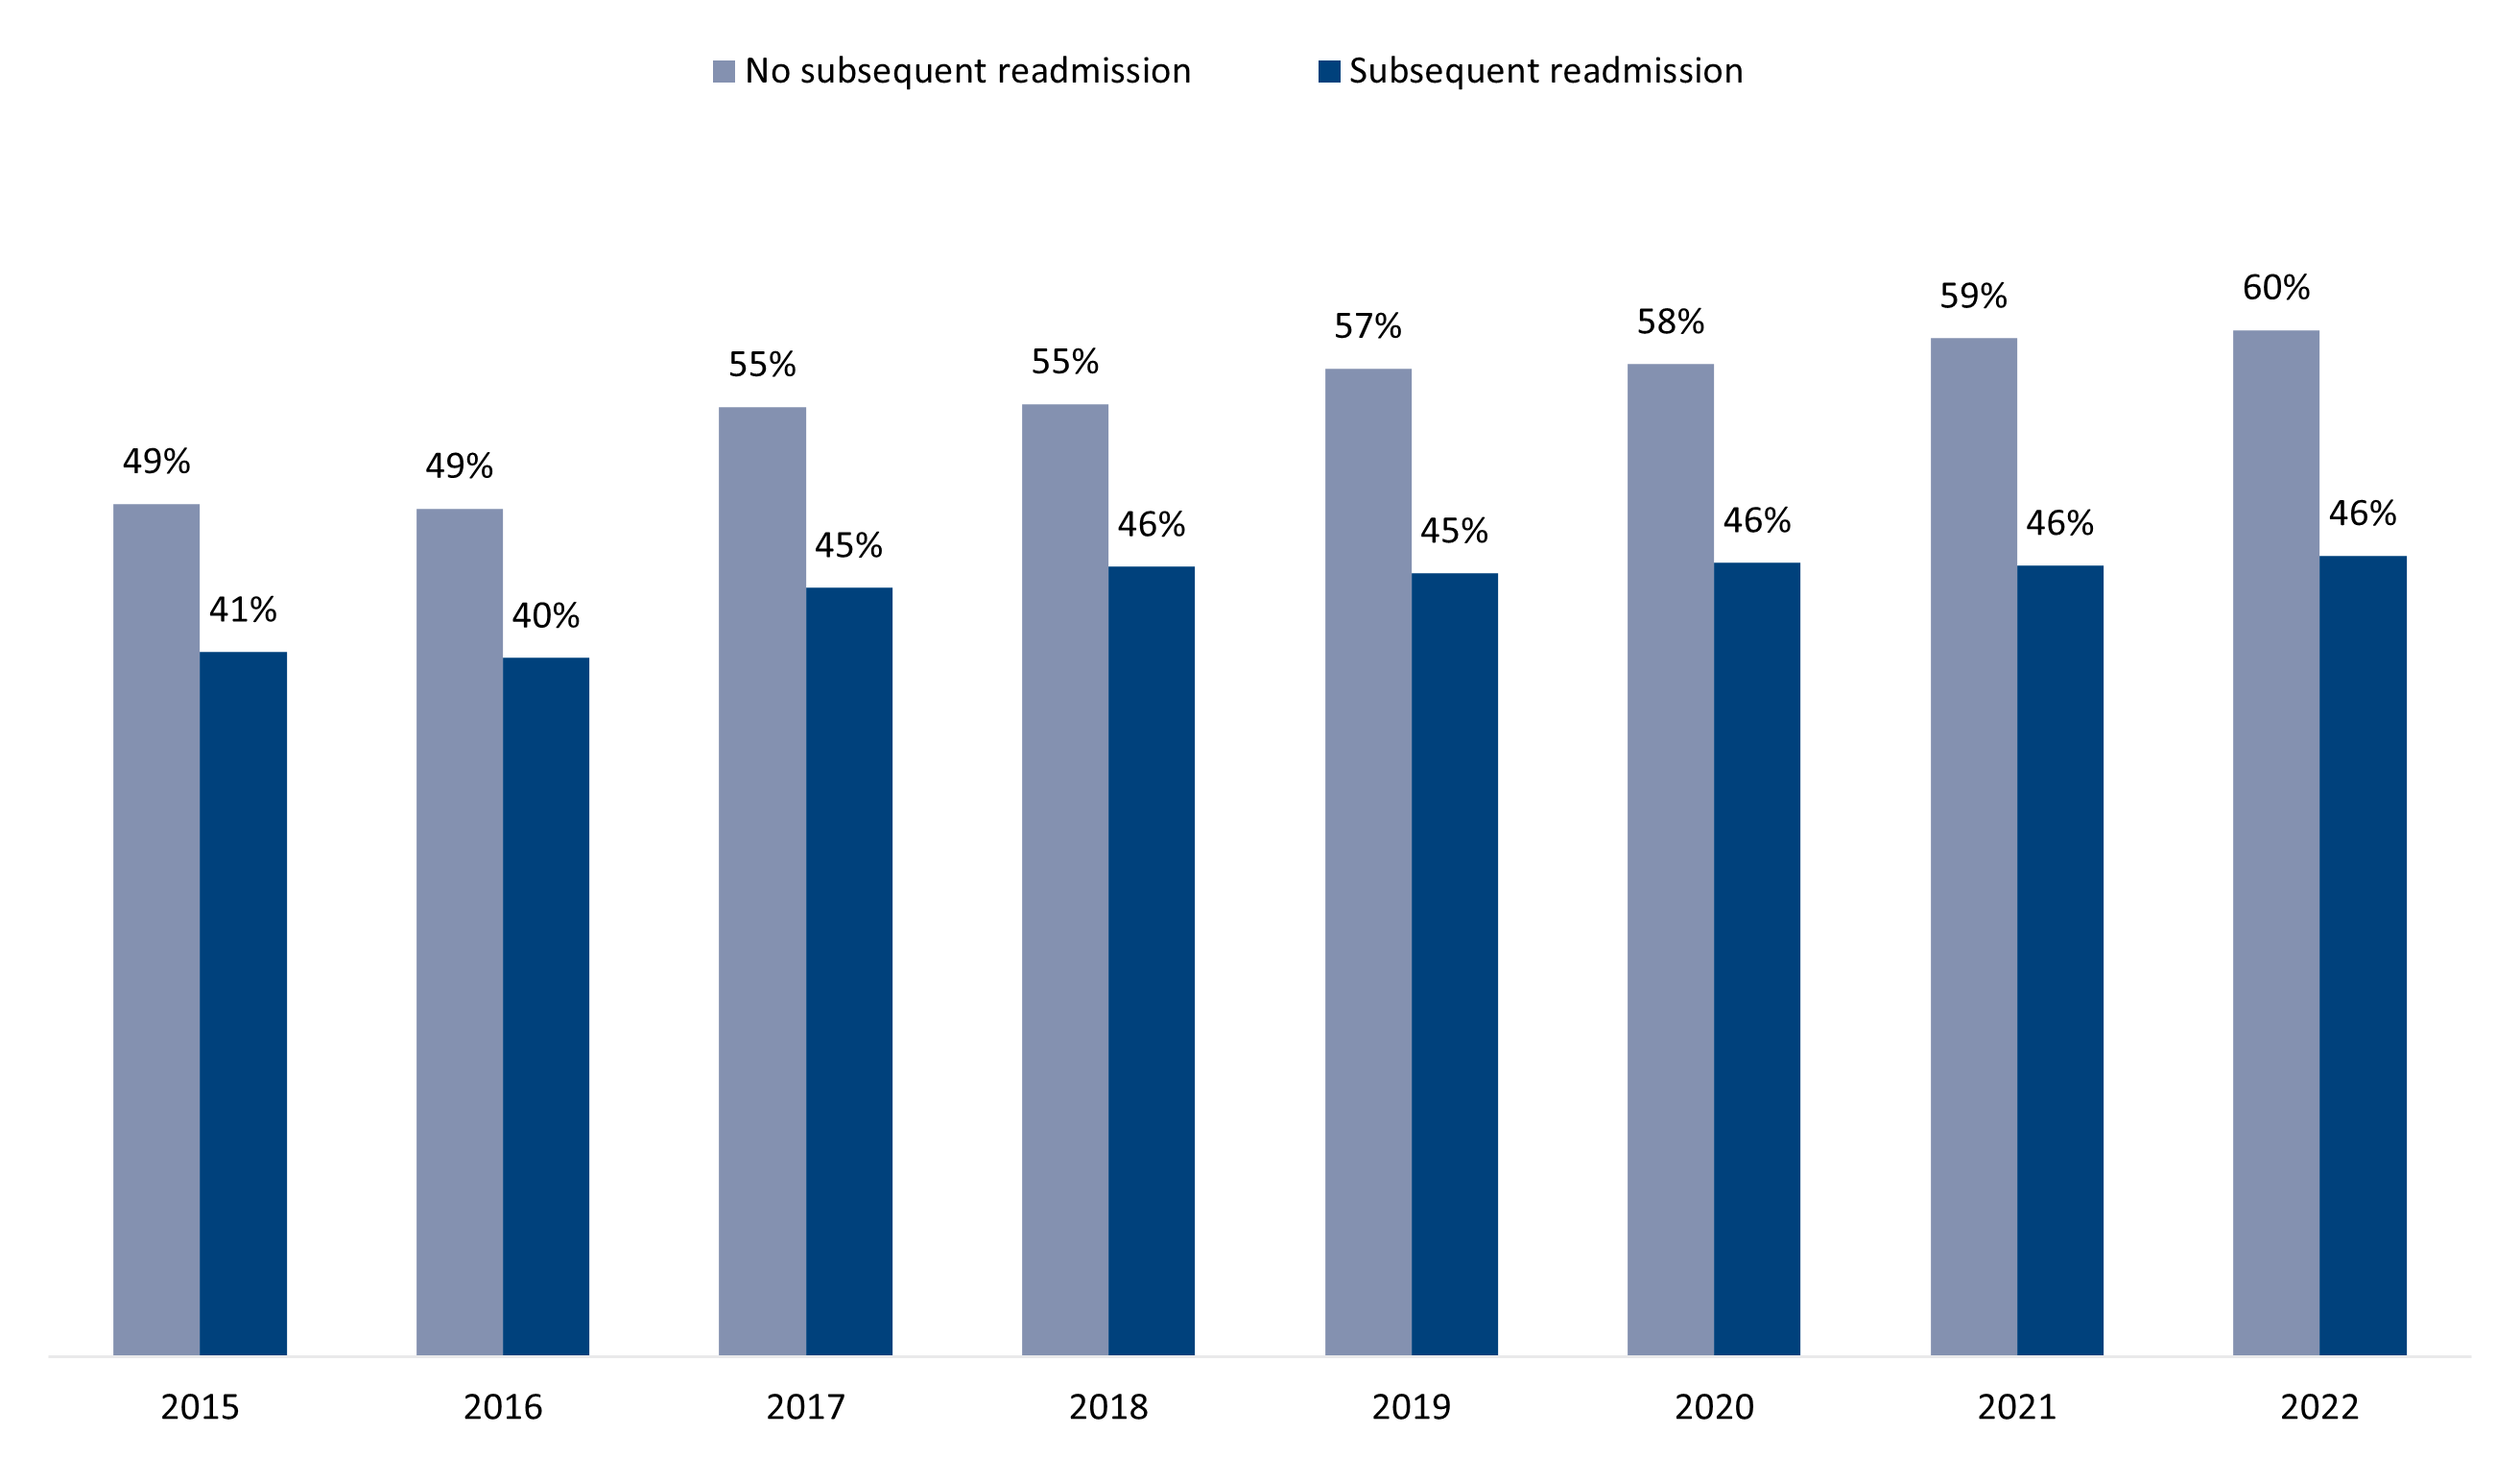
Figure 1: Proportion of patients who gave a top box rating for their overall satisfaction score split between those patients who experienced an unplanned readmission, and those who didn't, from 2015 to 2022.
Overall satisfaction scores were higher in those who didn't have an unplanned readmission than those who did, and this was true irrespective of their reasons for needing to go to hospital to begin with.
However, it is possible that patients who were more likely to be readmitted were sicker. Sicker patients might rate the hospital experience poorly because of how they feel while in hospital and their perceptions of care and also their higher risk of complications.
Comparing expected and actual patient satisfaction scores
We wanted to determine how the expected proportion of satisfaction scores for members with and without an unplanned readmissions compared with the actual proportions recorded.
Patients responded differently to the survey based on their personal circumstances.
For this reason, we looked at three years of data (2020 to 2022) and compared ratings after accounting for these factors:
- Severity of illness - measured by the type of service (surgical, medical or obstetrics)
- Whether patients had a day admission or overnight admission; emergency or non-emergency admission; COVID-19-related admission or non-COVID admission
- Demographic factors such as age, sex, language spoken, highest education level and self-rated health.
The models showed that we expected that the proportion of patients to score a top box rating would be lower for the group that had an unplanned readmission, than the group that was not readmitted which indicates to us that people who need unplanned readmissions are likely to be people who are more sick, who may experience complications and usually experience longer lengths of hospital stays.
Figure 2 shows that, for those who had an unplanned readmission, actual hospital ratings in 2020 (140.9%), 2021 (103.4%) and 2022 (137.7%) were higher than we anticipated in line with patients' individual circumstances (especially in 2020 and 2022).
- Keep in mind that where actual/expected 100% this means that actual and expected scores are aligned. So scores over 100% mean that the denominator (expected scores) in the equation is lower than the numerator (actual score).
Among patients with no unplanned readmission, the expected proportion who scored a top box rating was very close to the actual proportion (where actual/expected was between 98.9% and 100.4%).
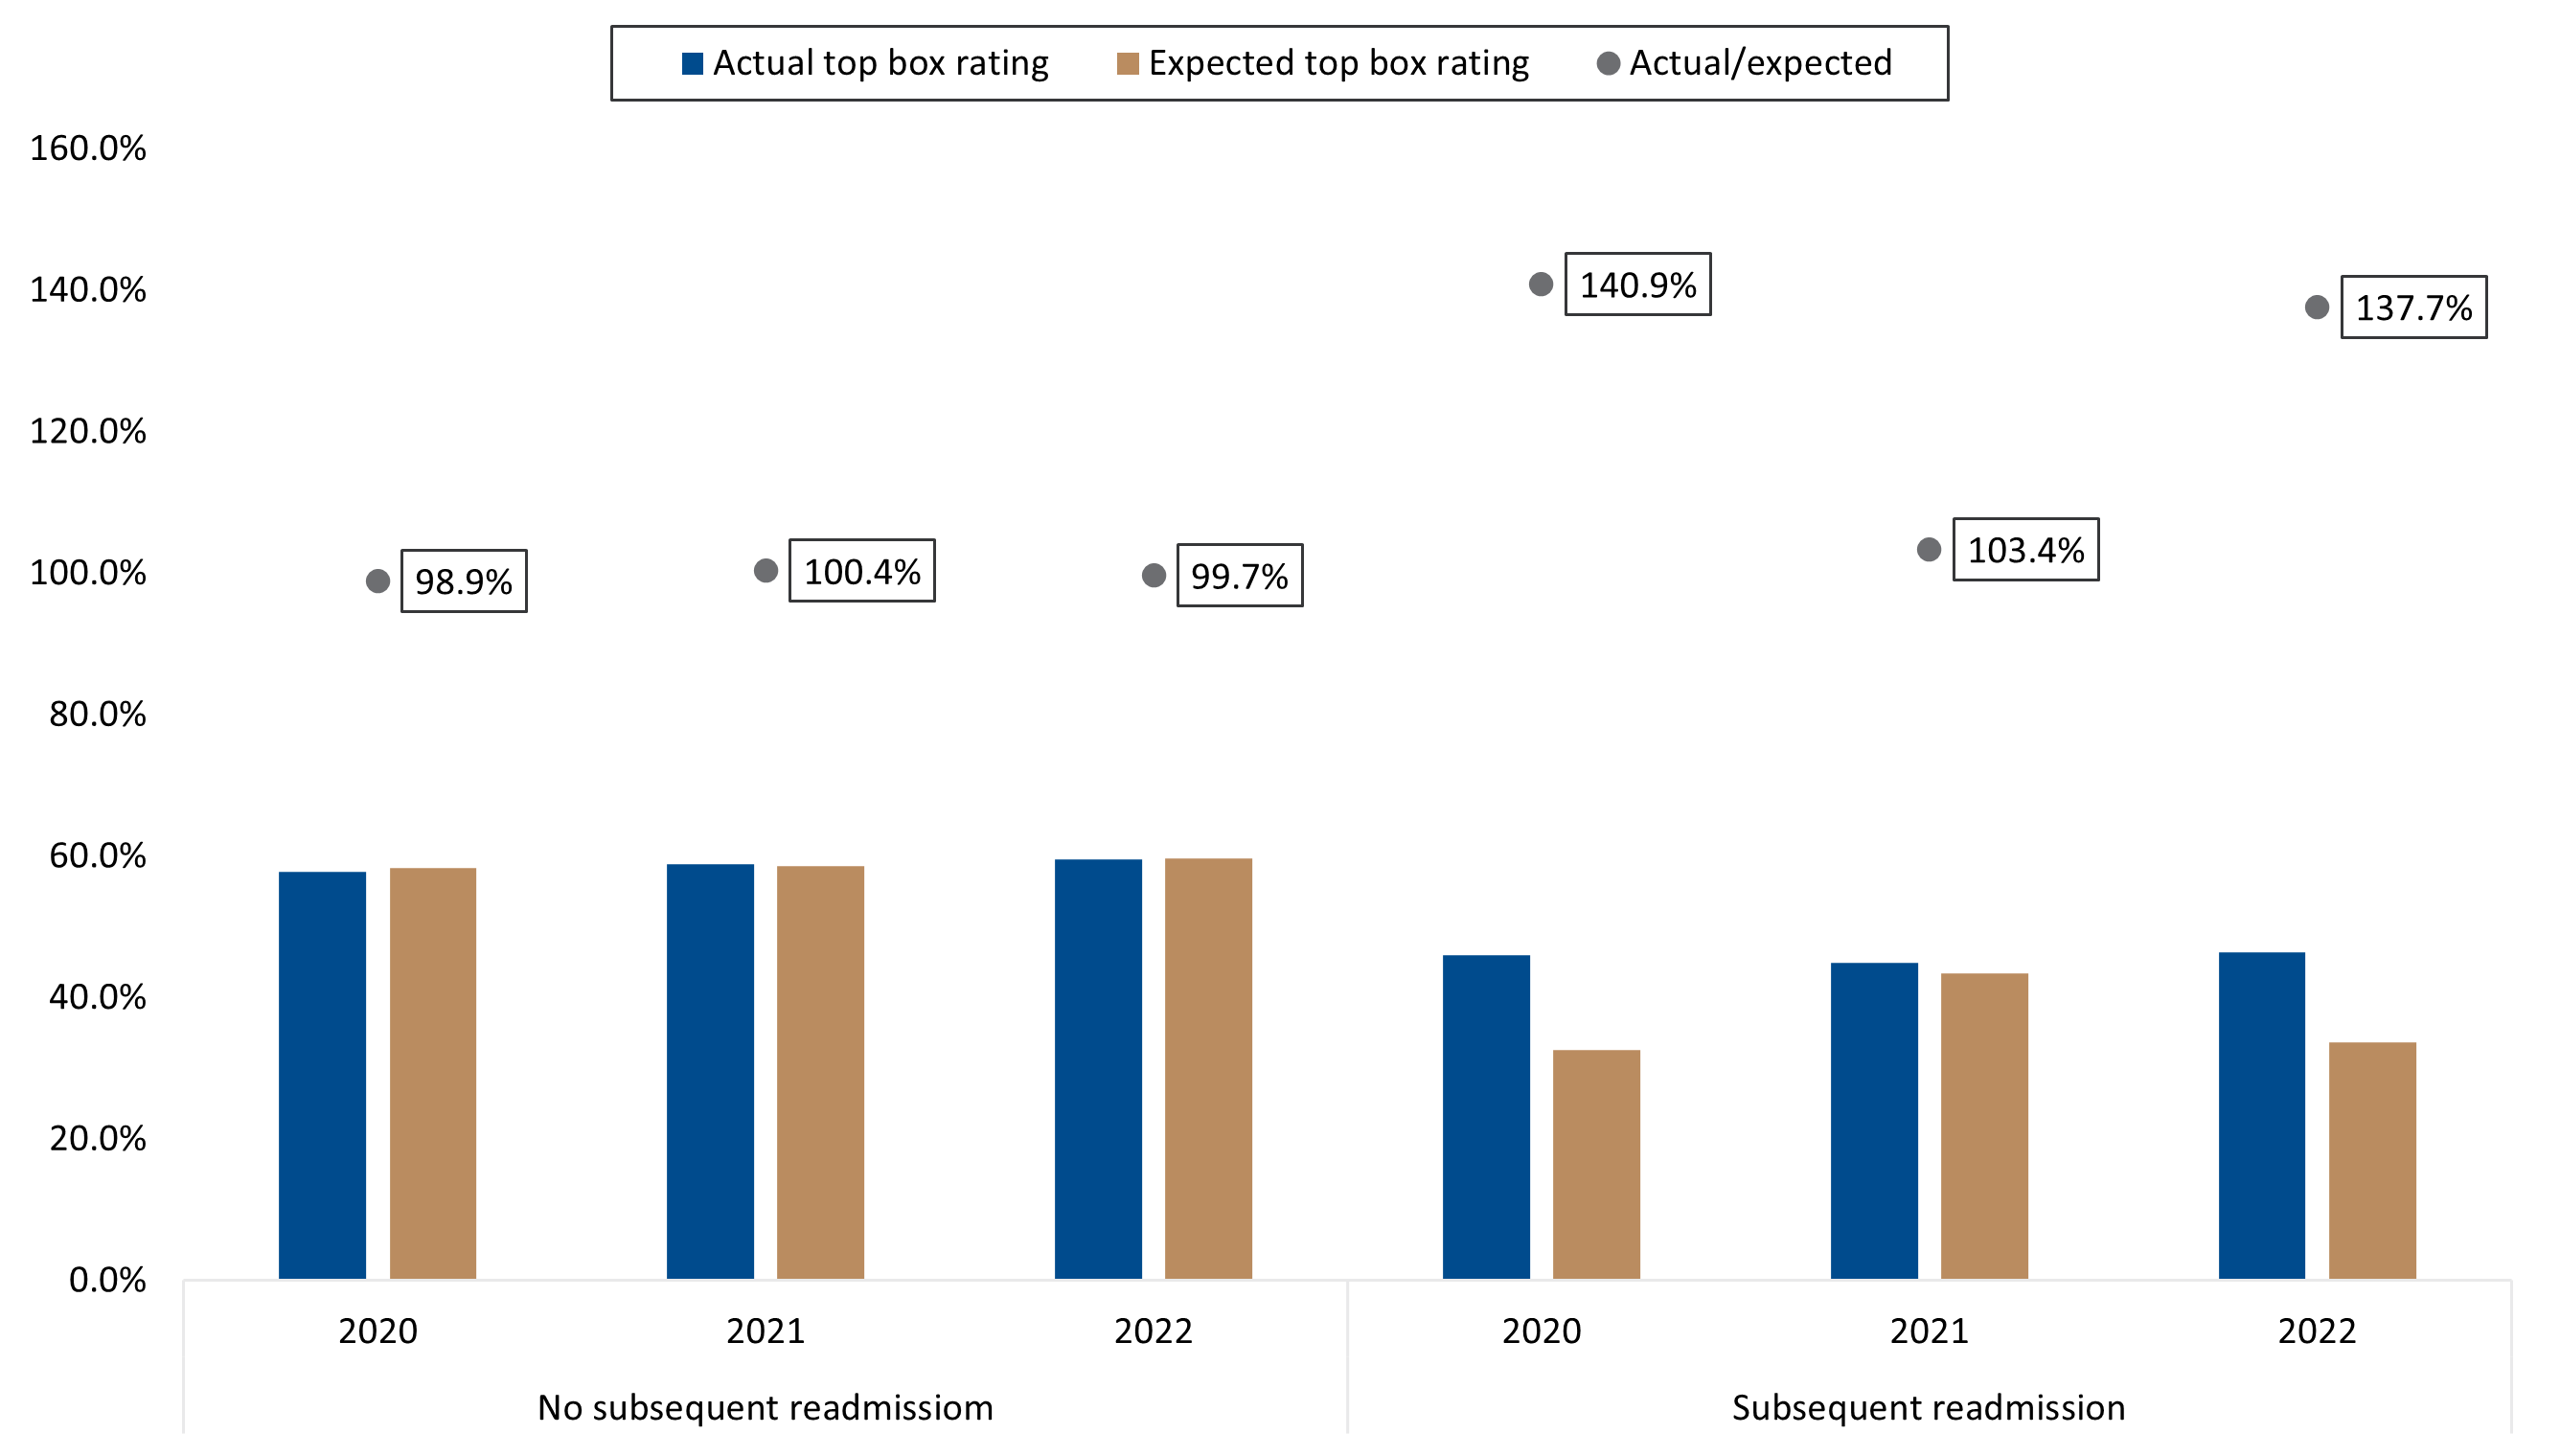
Figure 2: Actual versus expected proportion of patients who gave a top box rating in their overall satisfaction score on their hospital Member Experience Survey based on reason for admission and demographics.
Patient satisfaction at its lowest when scored during a readmission stay
How long did members take to respond to the survey? The survey is sent to members seven days after they are discharged from their index admission. The median response time (for both members with and without an unplanned readmission) was 13 days after discharge of the index admission.
For members with an unplanned readmission:
- 35% responded before their readmission date;
- 11% responded during their readmission stay; and
- 54% responded after their readmission.
Also, the timing of their filling out the survey influenced how they scored the hospital.
Patients who filled out their survey while readmitted had a lower proportion of top box ratings across most years, specifically in 2017, 2019, 2020 and 2021 (Figure 3). They may have felt additionally frustrated at the time of completing the survey due to their readmission.
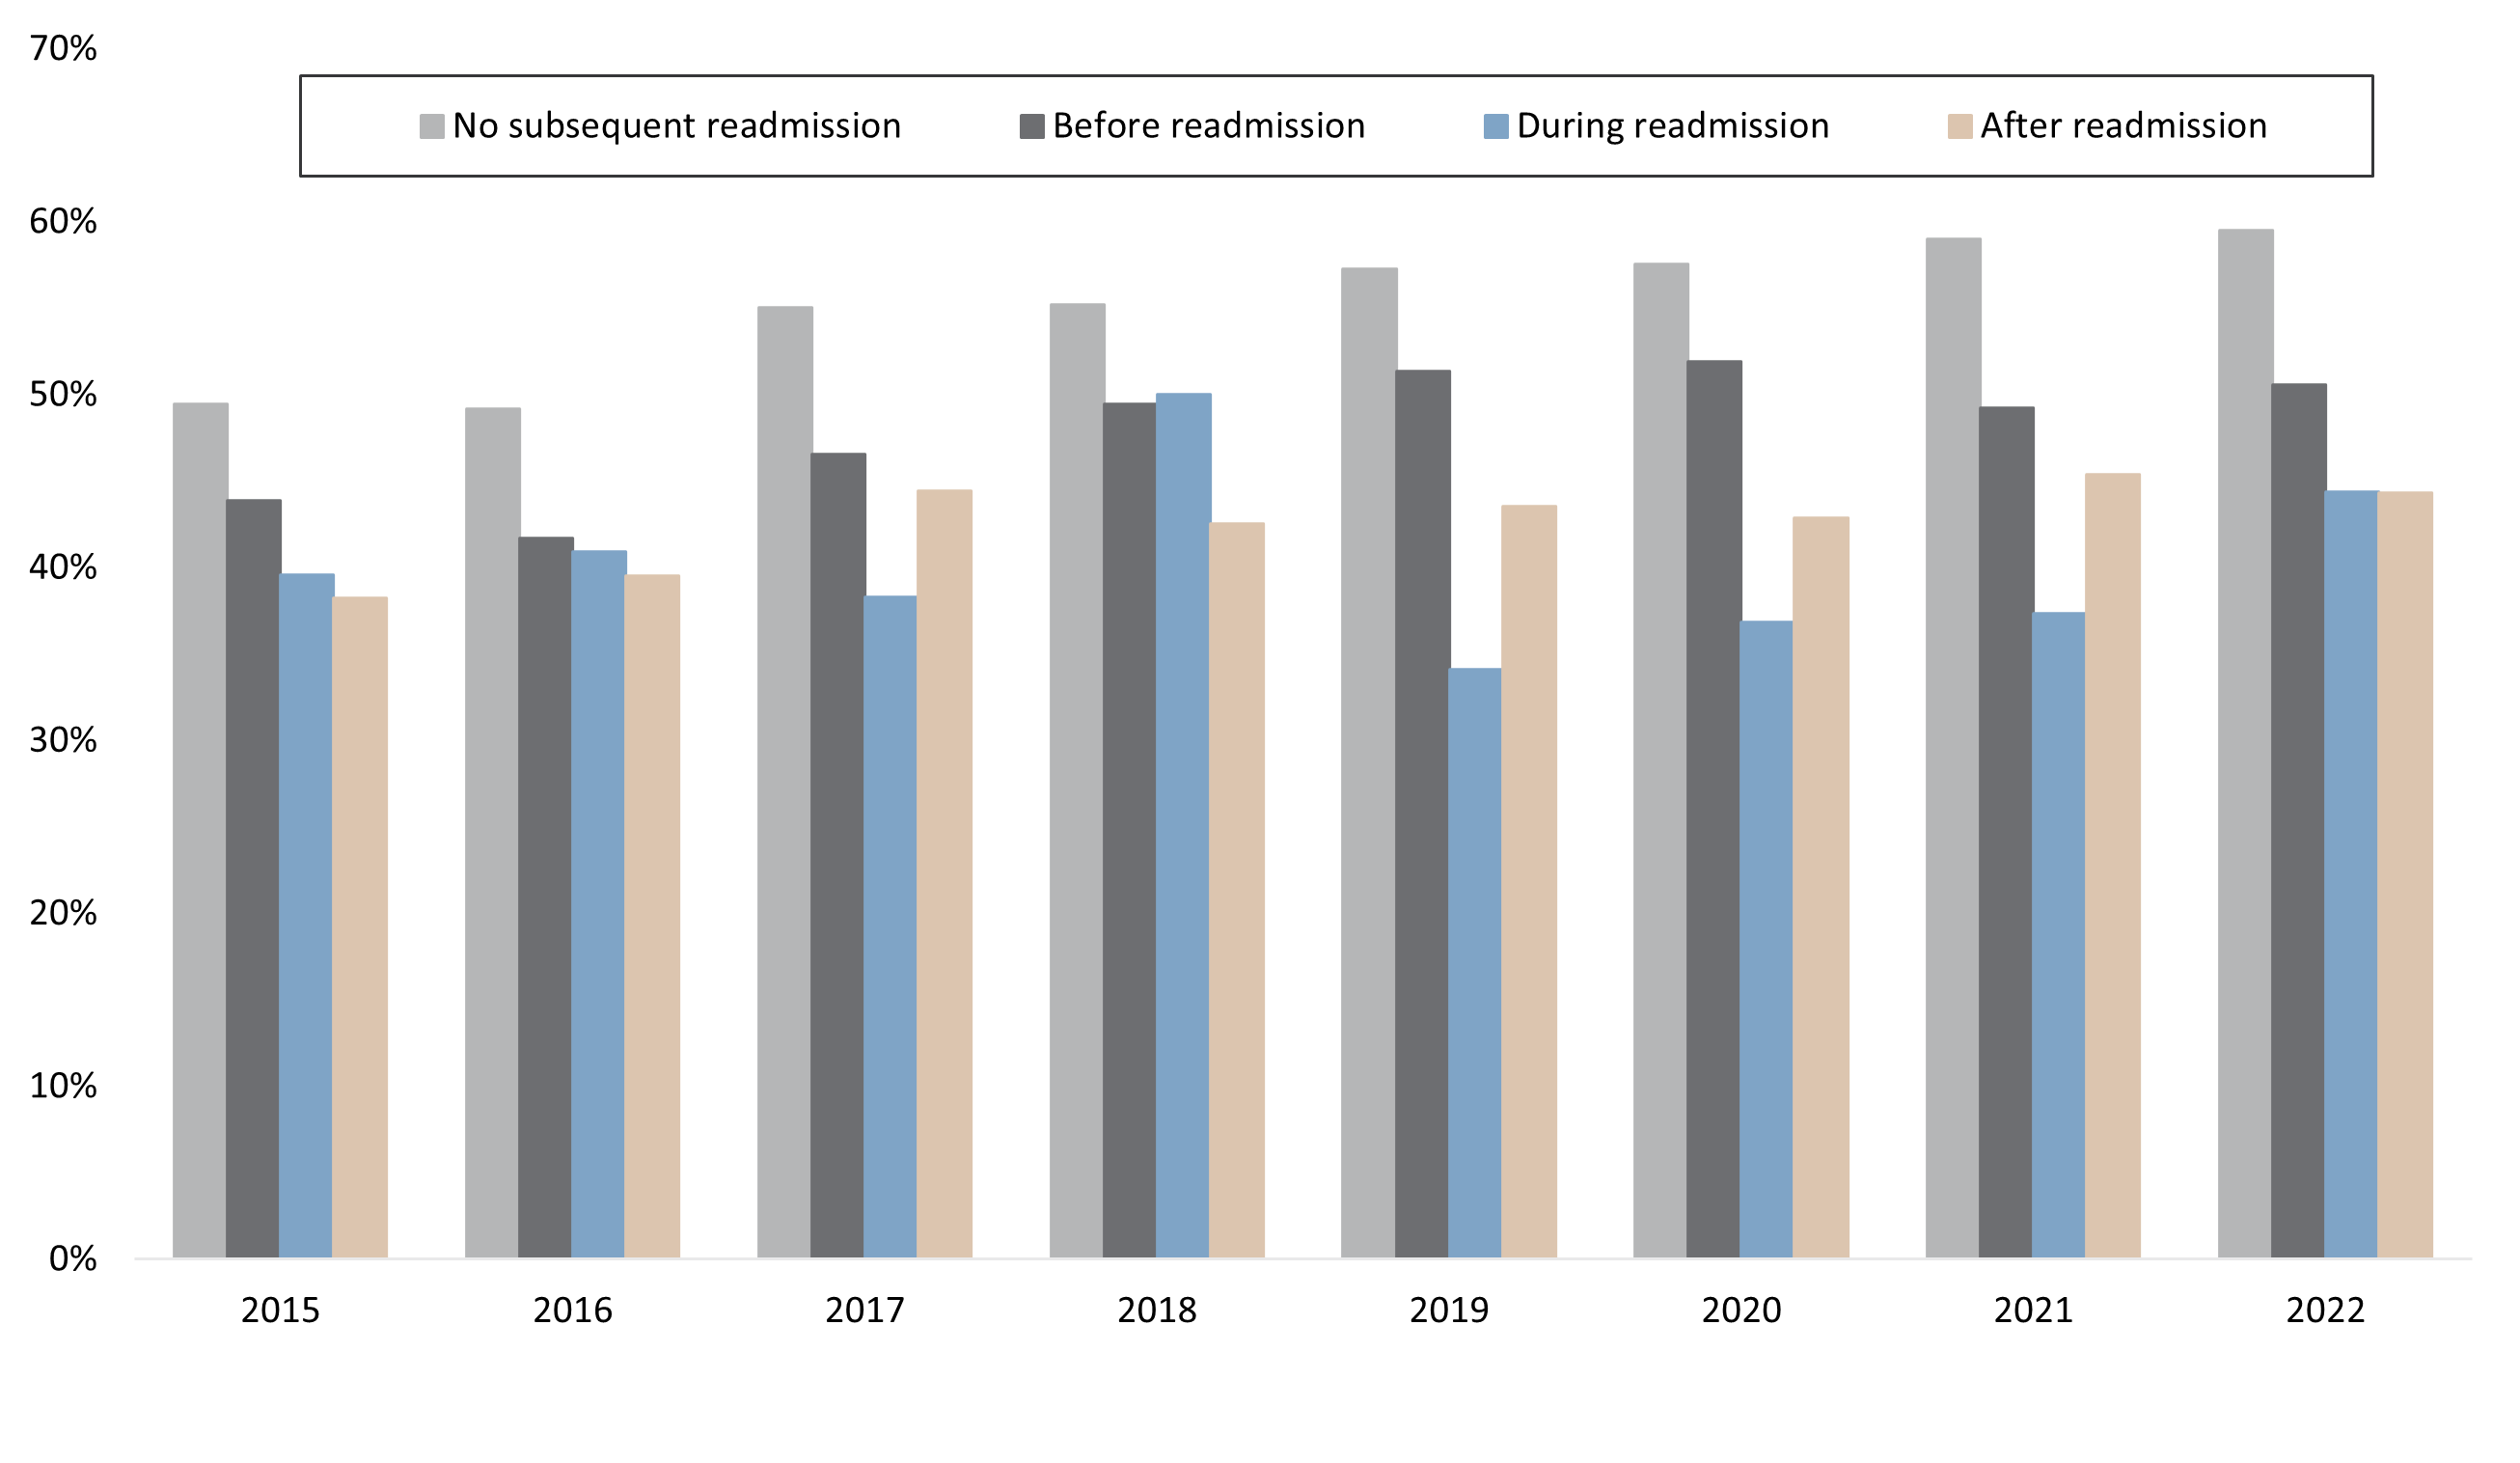
Figure 3: Proportion of patients who gave a top box rating for their overall satisfaction score across four groups - three readmission groups (showing the timing of the patient filling in the survey) and the 'no readmission' group.
Poor communication may result in subsequent readmissions
The Member Experience Survey asks 15 questions. For all questions, the proportion of patients who gave a top box rating was consistently higher among patients who did not experience and unplanned readmission than those readmitted.
This was true throughout the eight-year period analysed (Figure 4).
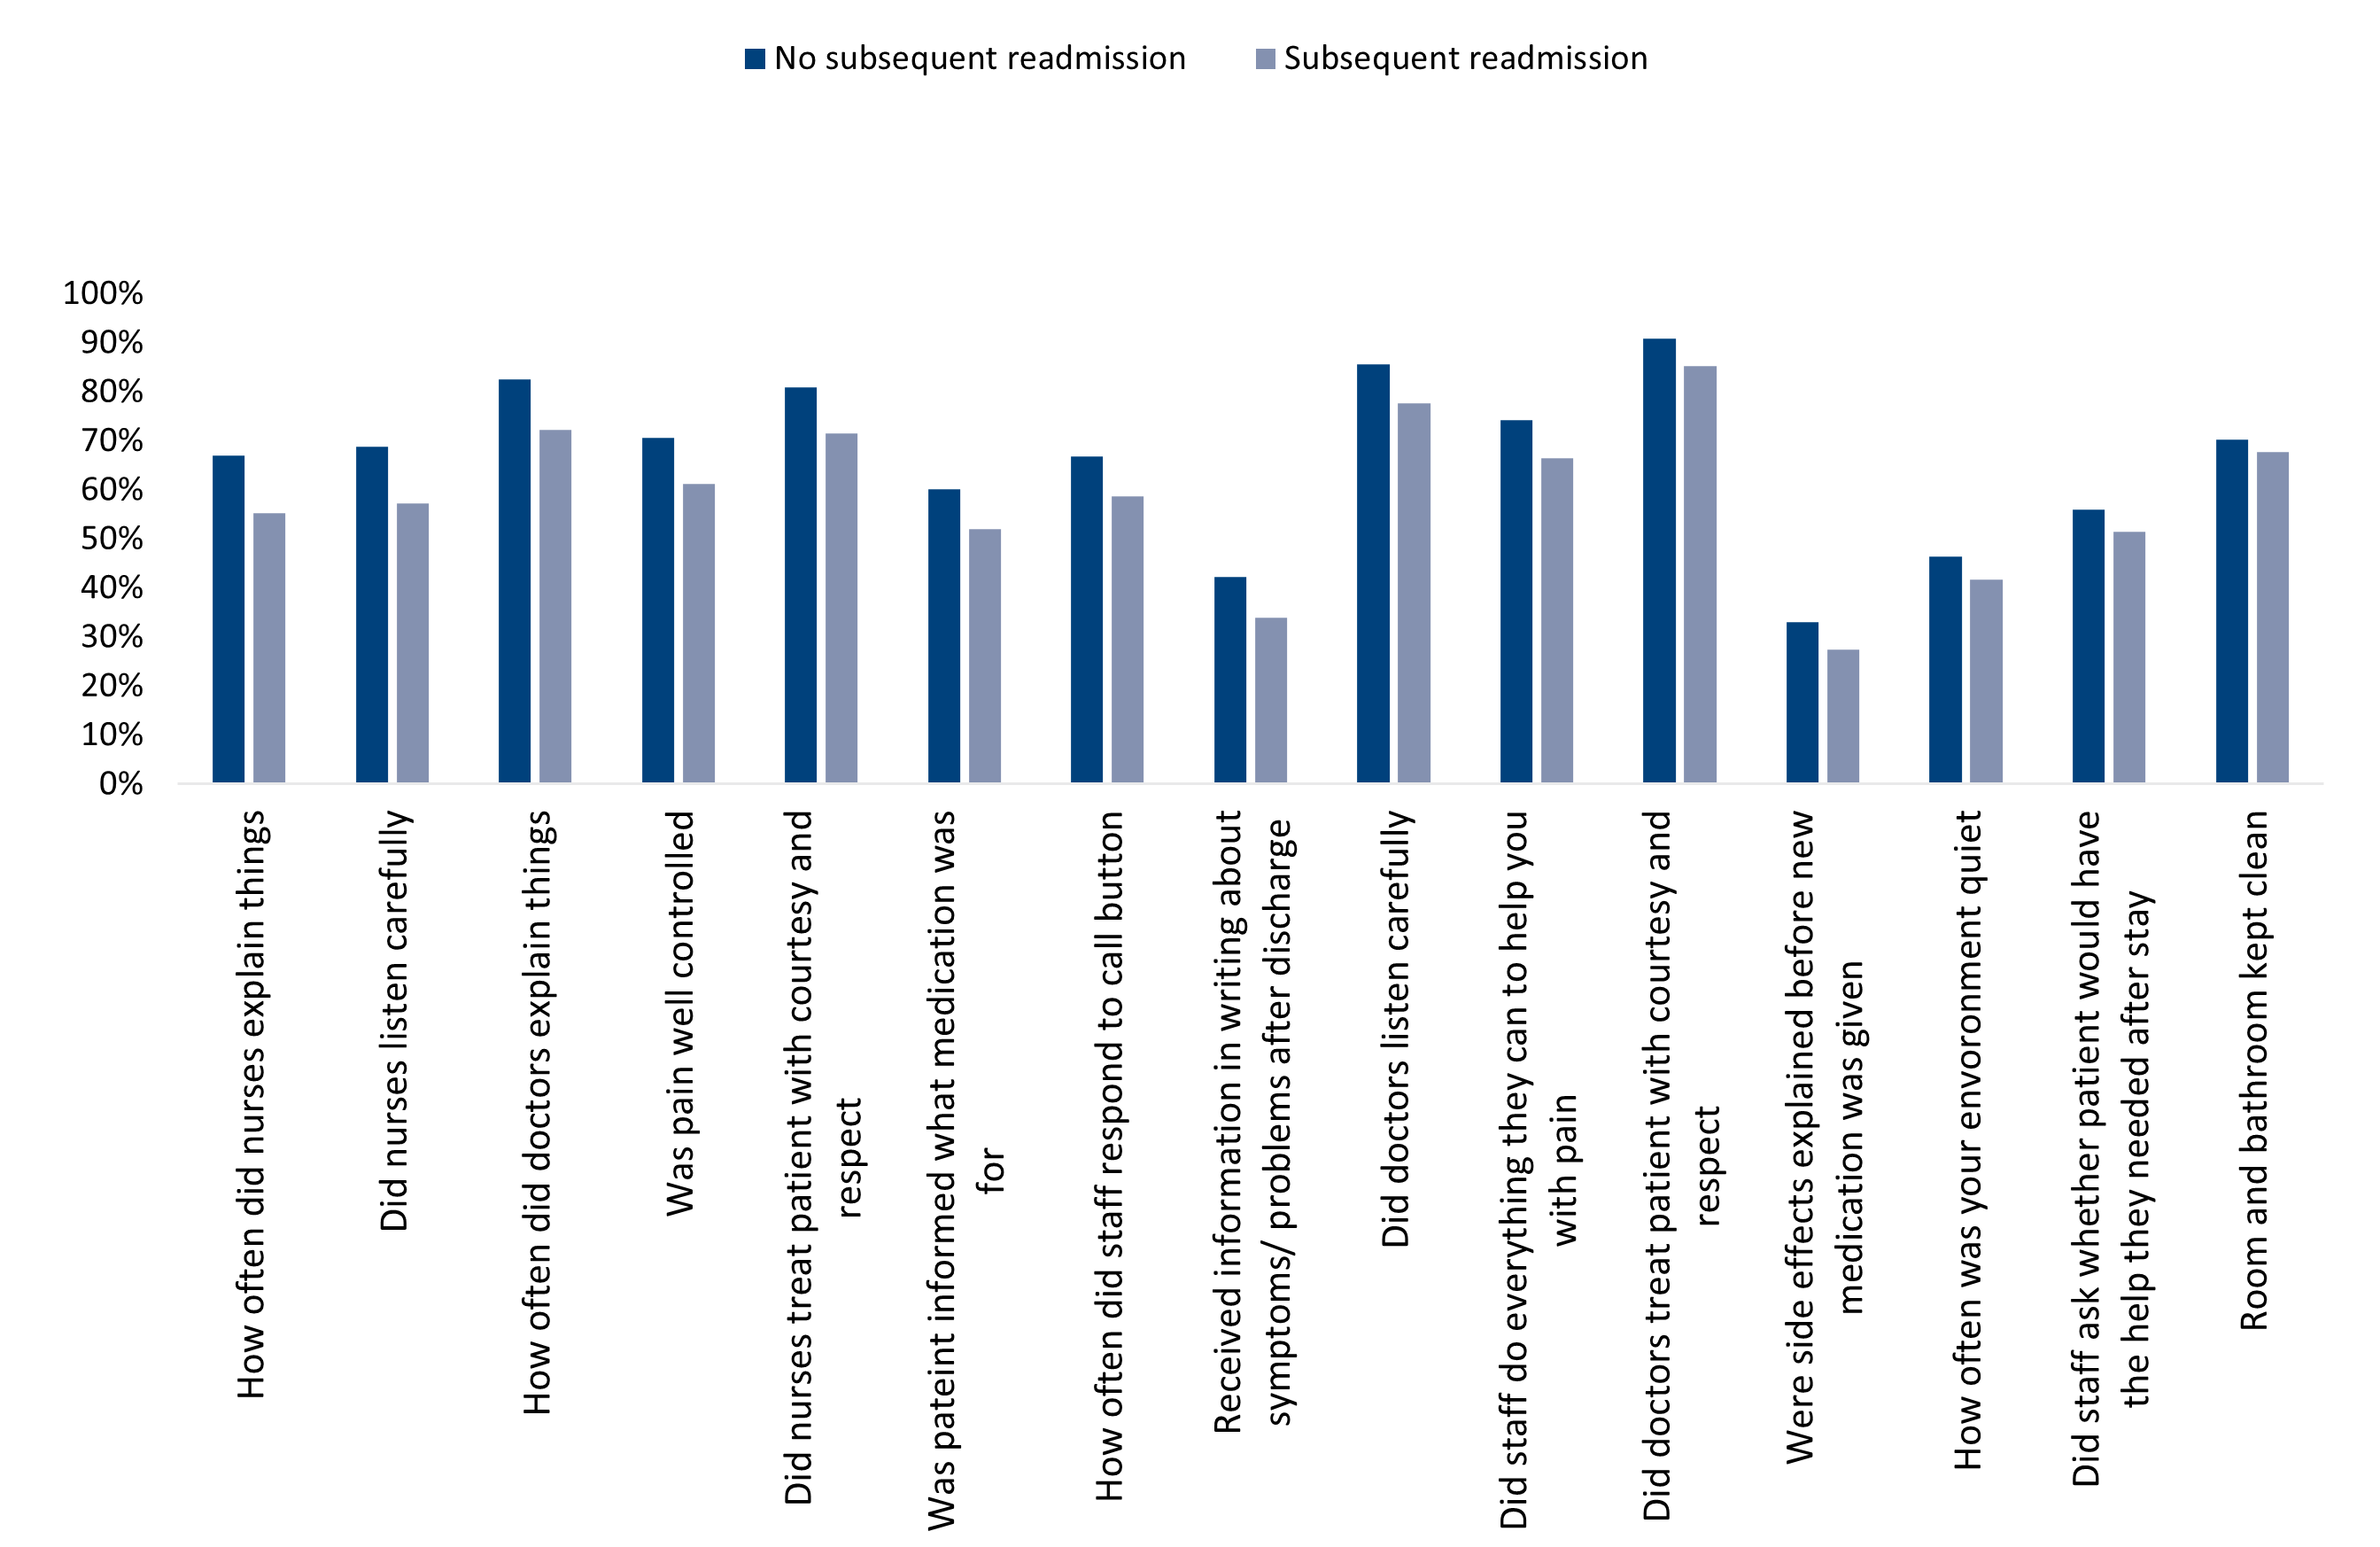
Figure 4: Proportion of patients with and without a readmission who gave their experience a top box rating during 2015-2022, with data for individual survey questions indicated.
The biggest percentage difference between the two groups was for the following three questions (Figure 5):
- How often did nurses explain things in a way you could understand?
- How often did nurses listen carefully to you?
- How often did doctors explain things in a way you could understand?
These discrepancies show that patients perceived gaps in the way the things are explained to them by the healthcare providers involved in their first admission. For example, if patients didn't understand information shared with them during their first admission, poor post-discharge knowledge could have led to negative outcomes and readmission.
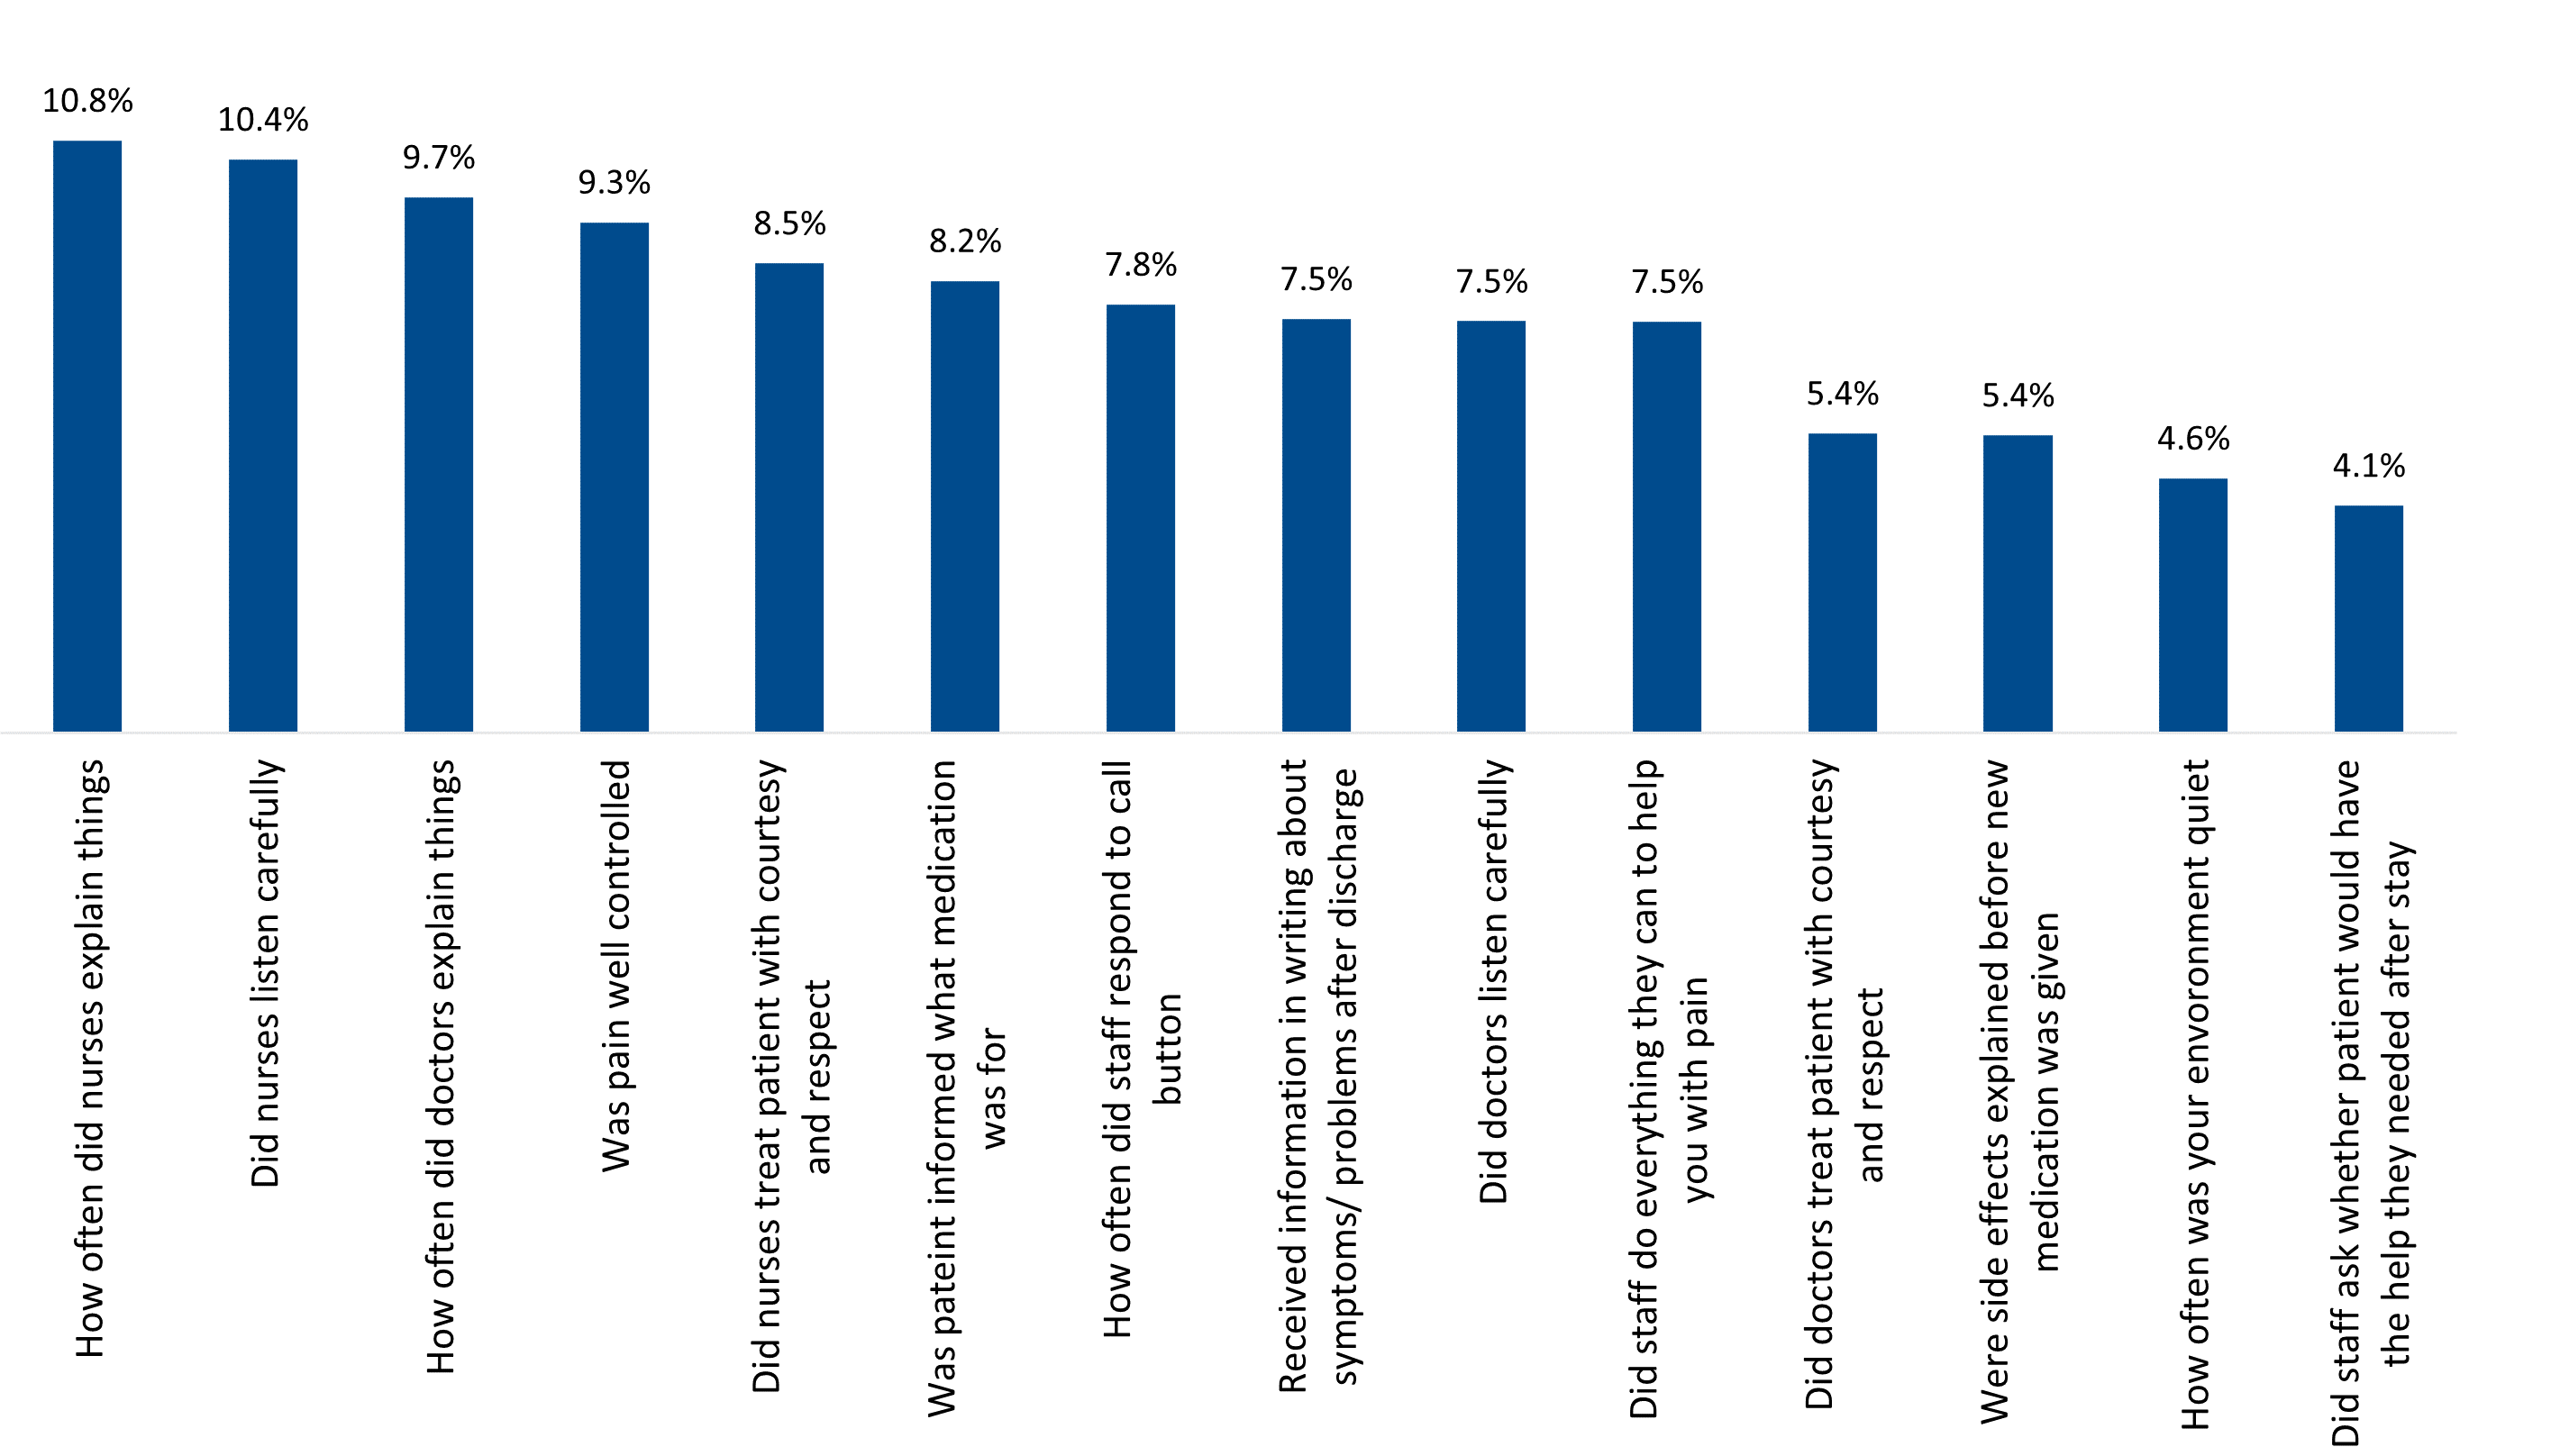
Figure 5: The average percentage difference, over the eight years study period, between patients with and without an unplanned readmission, who rated their index admission experience as top box.
Readmission rates remains a valuable measure of quality of hospital care
Across the world, readmission rates are often used as a measure of hospital quality. Discovery Health uses a Member Experience Survey to measure patient satisfaction across 15 areas related to a hospital admission. The Member Experience Survey is sent to administered medical scheme members 7 days after their discharge to an acute private hospital in South Africa.
Our analysis shows that patient satisfaction scores relating to an index admission were lower for patients who were readmitted within 30 days of being discharged from their index admission, than for those who did not experience and unplanned readmission.
This is true across our study period (2015-2022).
This analysis indicates opportunities for addressing areas of concern flagged by patients around their initial and follow-up treatment.
To recap: patients who experience an unplanned readmission and filled out the Member Experience Survey while readmitted, scored the index admission lower than those who filled it out before or after the sole index readmission. This alludes to patient frustration around the unplanned readmission.
Our analysis also highlights the importance of clear communication to patients during their index admission, and the way that poor understanding of dynamics related to a patient's stay and post-discharge care may contribute to a subsequent readmission.
Overall, actual versus expected top box score ratings also show that being more sick contribute to lower patient satisfaction scores, and patients who were readmitted felt dissatisfied with their index hospital experience.
- Proportion of hospital readmissions deemed avoidable: a systematic review | CMAJ
- Journal of Evaluation in Clinical Practice | Health Services Research | Wiley Online Library
- Is the Readmission Rate a Valid Quality Indicator? A Review of the Evidence
- Hospital Readmissions as a Measure of Quality of Health Care: Advantages and Limitations. Arch Intern Med.2000;160(8):1074-1081. doi:10.1001/archinte.160.8.1074
- Centers for Medicare Medicaid Services Planned Readmission Algorithm - Version 2.1 (maryland.gov)
Interested in knowing more or reporting on these findings?
Please contact us on MEDIA_RELATIONS_TEAM@discovery.co.za to request any updated data available since publication and to obtain any further context required. You may also be interested reading a related piece: "15-year analysis shows chronic kidney disease has significant effects on the Discovery Health Medical Scheme and its members."
Did you find this post interesting?
Please visit our Discovery Health Insights Hub for a range of analyses and insights shared by our Discovery Health Intelligence Team over the past three and a half years and spanning a variety of health-related themes. Look out for our recent 15-year analysis of the DHMS chronic kidney disease experience, where we also touch on transplantation rates.
All information shared on this page is based on perspectives gained from analysing data acquired by Discovery Ltd and its various affiliate entities (Discovery). The analysis, which is conducted by Discovery's actuarial and data science team, aims to encourage industry dialogue. Publications containing our analyses are shared for educational and informational purposes only. Each publication reflects only the data available for analysis at the time of publication. It does not, unless otherwise indicated, constitute peer-reviewed, published scientific research, and hence should not be interpreted as such or used as a basis for altering treatment decisions. While every effort has been made to ensure the accuracy of the content conveyed, we cannot be held liable or responsible for any actions or decisions taken based on the information shared in this article.