How healthy is our nation? Comparing disease prevalence among medical scheme members and the broader population in South Africa

Using 2023 GHS data, we compare disease prevalence (across diabetes, hypertension, asthma, HIV and AIDS, and cancer) in people with and without medical scheme cover in South Africa. The findings show key differences in the way that disease affects each group, and highlight how medical scheme membership supports access to care.
Authors
Discovery's Health Intelligence team members Vishrut Patel (Actuarial Analyst), Claudia Pastellides (Actuary), Amalia Theologides (Content Lead), Shirley Collie and Lara Wayburne (Chief Health Intelligence Actuary)
With thanks to Discovery Health's Roseanne Harris and Sarika Besesar for their review of the article.
Quick Overview
We compare the prevalence of specific chronic conditions reported on in the 2023 General Household Survey by Statistics South Africa, including diabetes, hypertension, asthma and also cancer, on a raw and an age-adjusted basis. In most cases, these diseases are more prevalent among those with medical scheme cover. This could be due to the medical scheme population being older and sicker than the non-medical scheme population, and possibly the result of scheme members having access to diagnosis and treatment for these conditions, as part of the Prescribed Minimum Benefits that all medical schemes are required to cover. Given that the GHS data are self-reported, the findings may understate true disease prevalence across medical scheme and non-medical scheme populations. There's also likely to be underdiagnosis in the non-medical scheme population due to challenges in accessing healthcare. The prevalence of HIV and AIDS is lower among the medical scheme population than the non-medical scheme population, highlighting both socio-economic differences between these populations and the importance of access to healthcare in preventing or managing this condition. Overall, these data and resulting insights offer valuable perspectives on disease burden and health-seeking behaviours in South Africa. The insights also underscore the role of medical scheme membership in giving people access to health information and care. We further consider how these dynamics drive anti-selection in the medical scheme landscape and look at how age distribution differs among scheme and non-scheme populations.
Background to this analysis
Non-communicable disease (NCD) prevalence is reshaping healthcare landscapes globally. Diseases like heart disease, diabetes, and cancer are responsible for 74% of all deaths worldwide. Four of the five key drivers of these diseases are behavioural: tobacco use, inactivity, harmful alcohol use, and unhealthy diets. The World Health Organization refers to global NCD prevalence as an 'epidemic' that has had devastating health consequences for individuals, societies and healthcare systems, making the prevention and control of NCDs a major global healthcare imperative.
Across the world, chronic diseases drive up healthcare costs and reshape demographics, forces that increase claims inflation. This drives up public healthcare spend, and, where people are members of a medical scheme, drives up contribution costs year on year, putting pressure on medical scheme sustainability.
In South Africa, medical schemes are not-for-profit, mutual funds that operate on the basis of legislated open enrolment and community rating as per the Medical Schemes Act. Medical scheme membership is usually optional (some employers require their staff to have cover). Anyone can join a medical scheme. Their monthly contribution relates to their chosen plan option and how many dependents they have on their policy (contributions are not based on member age or any other risk factors).
The 2023 General Household Survey by Statistics South Africa shows clear differences in the prevalence of certain diseases among those with and without medical scheme cover in South Africa. Diseases like diabetes and high blood pressure are more common among people with medical cover, partly because these people tend to be older and have better access to regular check-ups and opportunities for diagnosis, ideally early on. On the other hand, HIV is less common among people with medical scheme cover than it is in the non-scheme population.
The findings go beyond statistics, illuminating the benefits of medical scheme membership for everything from promoting health awareness to ensuring access to care.
How did we investigate the 2023 GHS findings?
Here, we look into forces shaping the population's health status in South Africa. Using age-adjusted metrics and examining a range of conditions, we aim to share insights into the interplay between medical aid membership and health-seeking behaviour and guide understanding of purchasing preferences around medical scheme cover.
We:
- Quantify disease prevalence levels between medical scheme members and non-members
- Risk-adjust prevalence levels to allow for age differences between these populations
- Identify potential reasons for differences in prevalence levels for each condition considered across both populations.
- Look at anti-selection trends: According to GHS data, the prevalence of several conditions is higher in the medical scheme population than in the non-medical scheme population - though under-reporting is also evident in the GHS medical scheme population at a condition level. Therefore we also explore the extent to which higher-risk (unhealthier) people may choose to become medical scheme members, driving a trend called anti-selection (a member choose to become medical scheme members, driving a trend called anti-selection (a member joins a scheme expecting that they will need to claim for a condition). Waiting periods are sometimes put in place in this case, to protect the long-term sustainability of medical schemes and insurers and to prevent anti-selection.
- We also explore the differences in age distribution of the population with medical scheme cover and those without medical scheme cover and analyse how this distribution has changed over time.
A note on these data sources used for our analysis
These data have been sourced from the 2023 General Household Survey (GHS) performed by Statistics South Africa2 . At the time of publication, this was the latest available national, population-level data on disease prevalence.
These data provide a valuable source of population-level estimates on disease prevalence for medical scheme and non-medical scheme cohorts, enabling us to measure disease prevalence for lives with and without medical scheme cover. We use the split of medical scheme lives to represent the experience of the medical scheme population.
We have used these data because it provides a consistent view of disease prevalence for the South African population and various population segments considered.
We note the following key features of the General Household Survey data for the purposes of this analysis:
- The study format is based on self-reported data using interview-style questions. Due to the self-reported nature of the GHS data, disease prevalence may be underreported. This may be for various reasons, including, but not limited to, respondents not being aware of the disease prevalence and non-disclosure of their conditions.
- DHMS data for each condition show a higher disease prevalence than the GHS data. This highlights anti-selection in the medical scheme environment and the underreporting of disease prevalence in self-reported data.
- Statistics South Africa GHS statistical methodology is used to extrapolate observations across the South African population.
- It is important to note that the GHS self-reported data might overestimate the size of the medical scheme population. This is because people who have health insurance products (e.g. primary care cover, which is not medical scheme cover) may indicate that they have medical scheme cover when they do not, simply due to a lack of understanding of the differences between these products. Chronic conditions and cancer types included in this analysis are those relevant to the medical scheme population and benefits this population access through the Prescribed Minimum Benefits Chronic Disease List, which each medical scheme is required to cover.
Important factors to note in relation to our analysis and results:
- Age is used as a demographic risk adjustment factor - a reliable and consistent metric in both data sets. However, other factors (such as lifestyle differences) may explain differences in chronic condition prevalence that are not reflected in the sedata.
- Definitions of diseases may differ, including respondents' interpretation of the question for each disease and their knowledge of their own health status.
- There may be potential under-diagnosis in both the medical scheme non-medical scheme populations, however this may be exacerbated in the non-medical scheme population.
- Although self-reported disease data can be considered as a reliable source of condition prevalence3 , there may be differences in the level and consistency of reporting by disease, which may influence the results.
- There are differences in access to benefits available to the medical scheme population, both within the medical scheme population and compared to the non-medical scheme population.
- These data and study do not account for people having multiple diseases or conditions.
What do we know about the age profile of the South African population?
South Africa has a relatively young population. According to the 2023 GHS, in that year:
- 36.8% of the population was under 20 years of age
- 8.9% of the population was over the age 60 years
- In contrast, in the medical scheme population 30.3% of people were younger than 20 years of age and 12.4% were over the age of 60. The medical scheme population also had a higher share of lives in each band over the age of 35 years (52.1% of lives) than the population without medical scheme cover (35.4%), and fewer lives below the age of 35.
- The largest difference in age distribution was for young adults aged 20 - 29 as only 9.8% of these lives in this age group are medical scheme members, compared to 17.2% of the non-medical scheme population being in this age group.
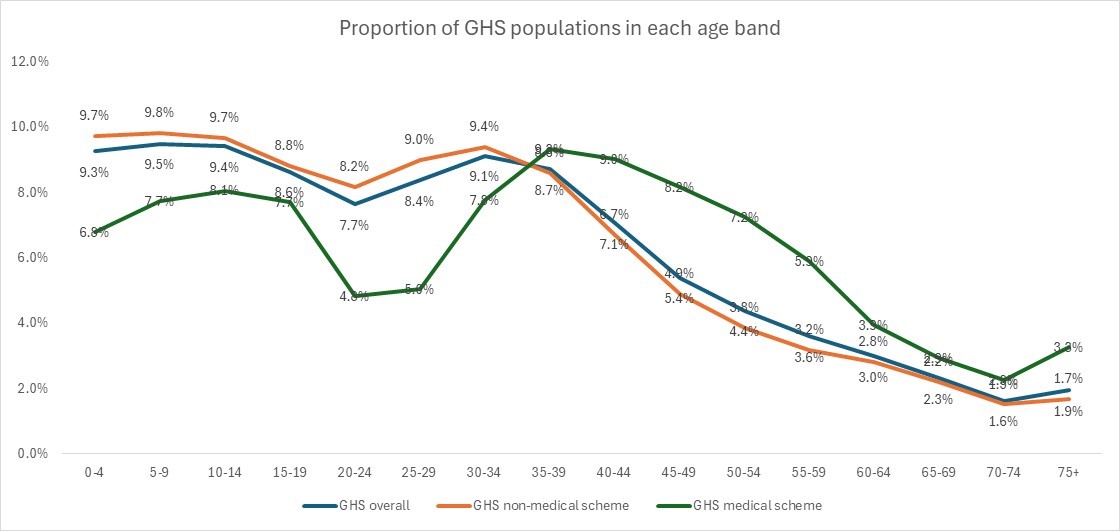
Figure 1: Age distribution of the South African population overall, and also by medical scheme and non-medical scheme membership, as measured by the 2023 GHS
How does disease prevalence differ between people with and without medical scheme cover?
All registered medical schemes in South Africa are required, by law, to cover Prescribed Minimum Benefits (or PMBs) for all members on all plan options. The Chronic Disease List (CDL) forms part of PMBs and includes 27 chronic conditions for which schemes must cover costs related to diagnosis, treatment, and care. Medical schemes also have eligibility criteria for members to meet, to register for these chronic conditions.
Using the 2023 GHS data, we compare the prevalence of chronic conditions (referred to as diseases) between people with and without medical scheme cover. We identify prevalence levels for each disease type, focusing on conditions that are part of the CDL, and also on cancer.
The conditions we look into are:
- Diabetes
- Hypertension (chronic high blood pressure)
- Cancer
- Asthma
- HIV and AIDS
To determine disease prevalence among the South African population, the GHS questionnaire asked respondents whether they had ever been diagnosed with each condition in question.
This analysis is based on the singular conditions as reported by GHS. However, in reality, people are likely to have more than one condition, impacting the complexity of their health status.
Diabetes prevalence trends
Analysis of the 2023 GHS data show that the prevalence of diabetes increases steadily with age from 40 years on, in both the medical scheme and non-medical scheme populations.
A sharp increase is seen from ages 45-49, with steady increase into older ages. The peak age for prevalence is 65-69 years at 18.1% for the medical scheme population and 18.7% for the non-medical scheme population.
For lives older than 35, the prevalence of diabetes is higher among those with medical scheme cover than those without cover.
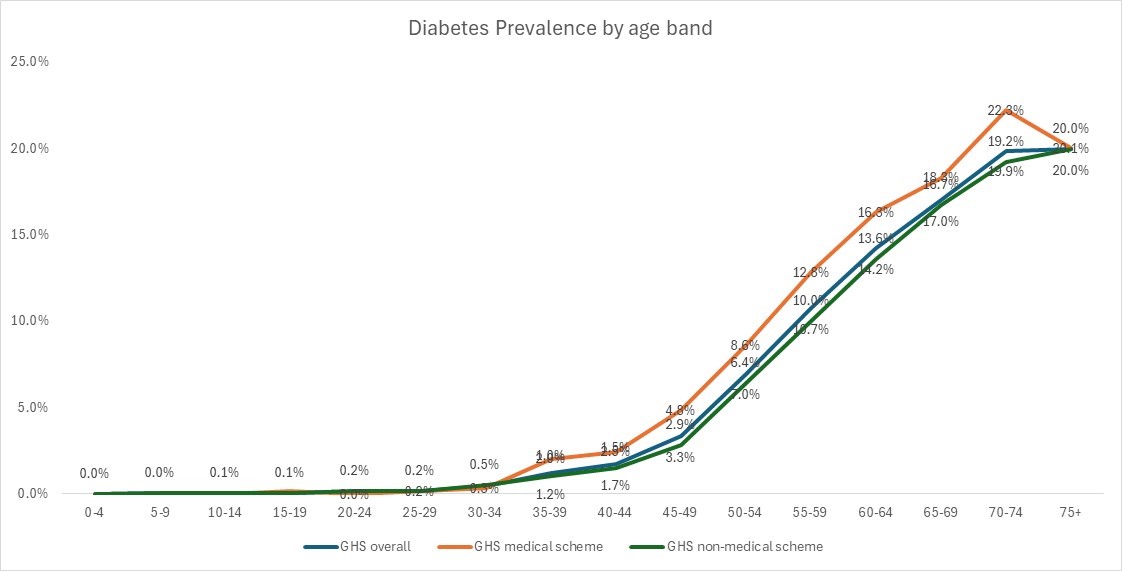
Figure 2: Diabetes prevalence by age band in 2023.
Based on GHS data, in 2023 the self-reported prevalence of diabetes was 2.7% for the whole population.
Without adjusting for age, an estimated 4.6% of the medical scheme population lived with diabetes compared to 2.4% for non-medical scheme lives.
As the prevalence of diabetes increases with age and the medical scheme population is older than the non-medical scheme population, we have adjusted for the age differences of the population to compare diabetes prevalence levels.
On an age-adjusted basis, the prevalence of diabetes among the medical scheme population is higher than the prevalence among the non-medical scheme population at 3.2% compared to 2.7%. Even after adjusting for age, the prevalence of diabetes in the medical scheme population is slightly higher than for the non-medical scheme population.
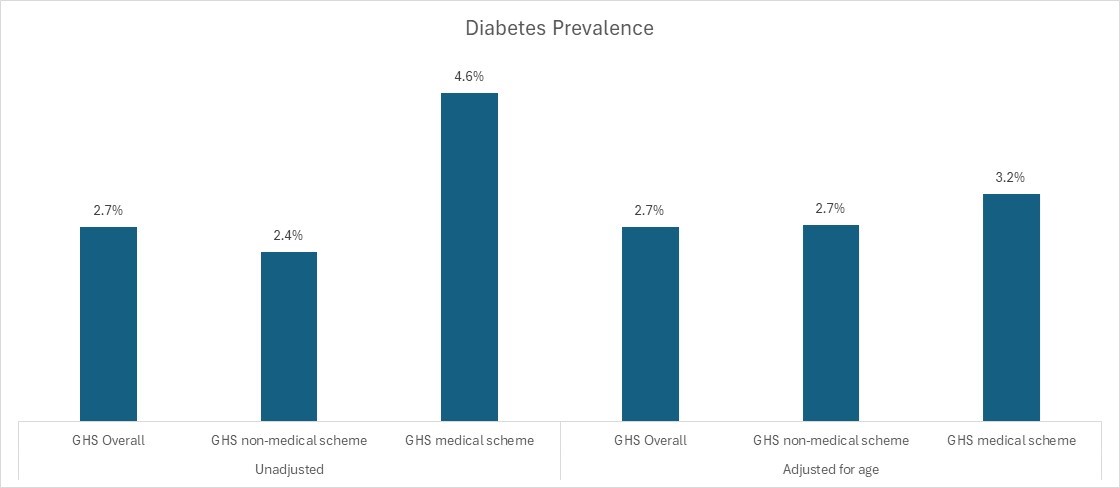
Figure 3: Diabetes prevalence among the overall, medical scheme and non-scheme populations showing unadjusted prevalence and age-adjusted prevalence (2023).
GHS data show how age shapes hypertension rates
According to the GHS data, 8% of South Africans were living with hypertension in 2023, with a 7.4% prevalence among the non-medical scheme population and 11.3% among the medical scheme population.
Hypertension prevalence for the non-medical scheme population increases for each age band, from the age of 15, peaking at 52.9% for those aged 75 years and above. By age, hypertension prevalence rates are similar for medical scheme and non-medical scheme lives.
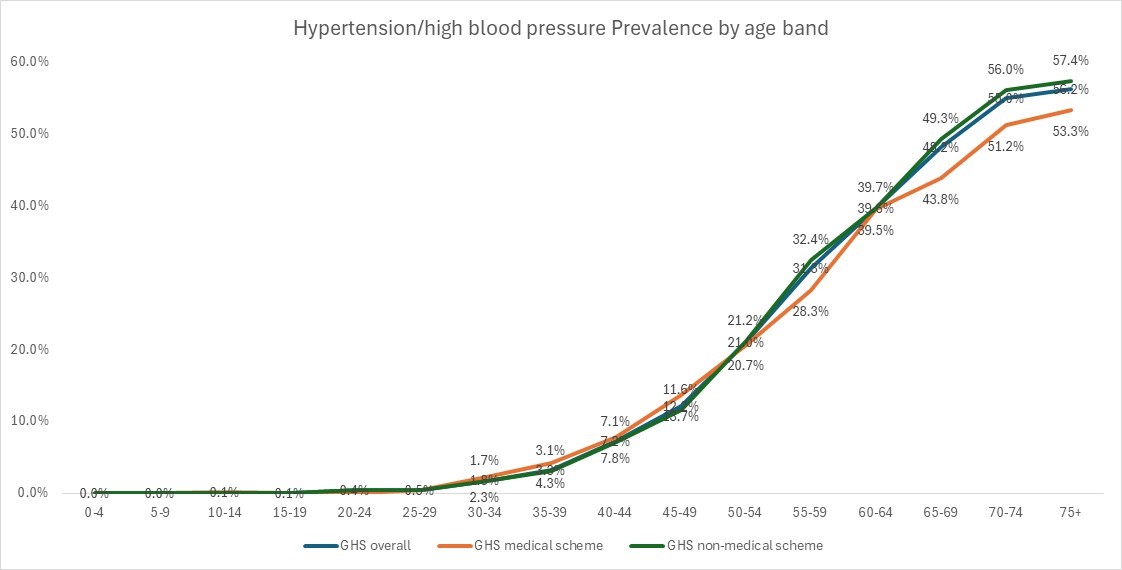
Figure 4: Hypertension/ high blood pressure prevalence by age band in 2023.
After adjusting for differences in age between the populations, the prevalence of hypertension becomes even more similar between medical scheme lives - 7.9% - and non-medical scheme lives - 8.1%.
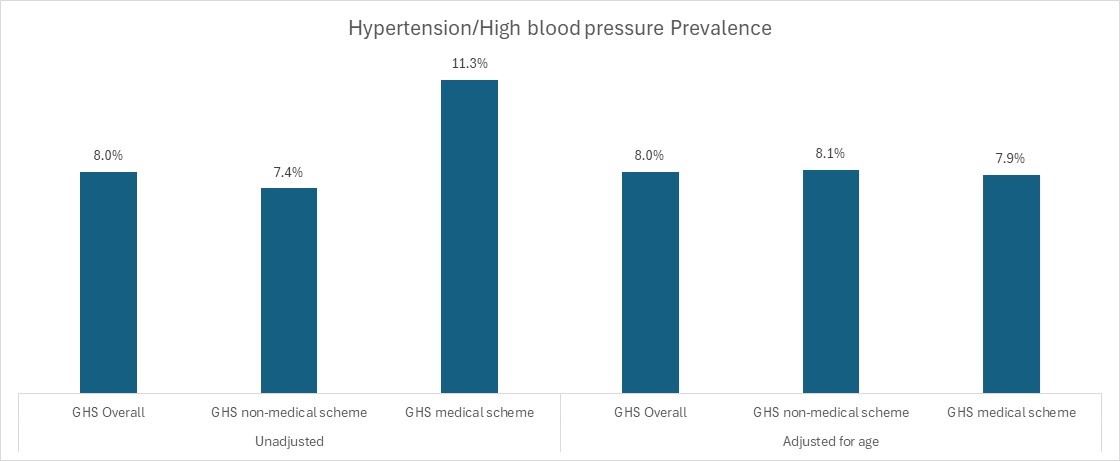
Figure 5: Hypertension/ high blood pressure prevalence among the different population groups showing unadjusted vs age-adjusted data (2023).
GHS data reveals how cancer prevalence rises with age and medical scheme cover
Our analysis of the 2023 GHS data shows that cancer prevalence increases with age. Cancer peaks in the 70-74 age band both in the overall population and in medical scheme and non-medical scheme populations. In this age band, medical scheme lives have a relatively high prevalence of cancer peaking at 7.4% compared to 1.2% for non-medical scheme lives.
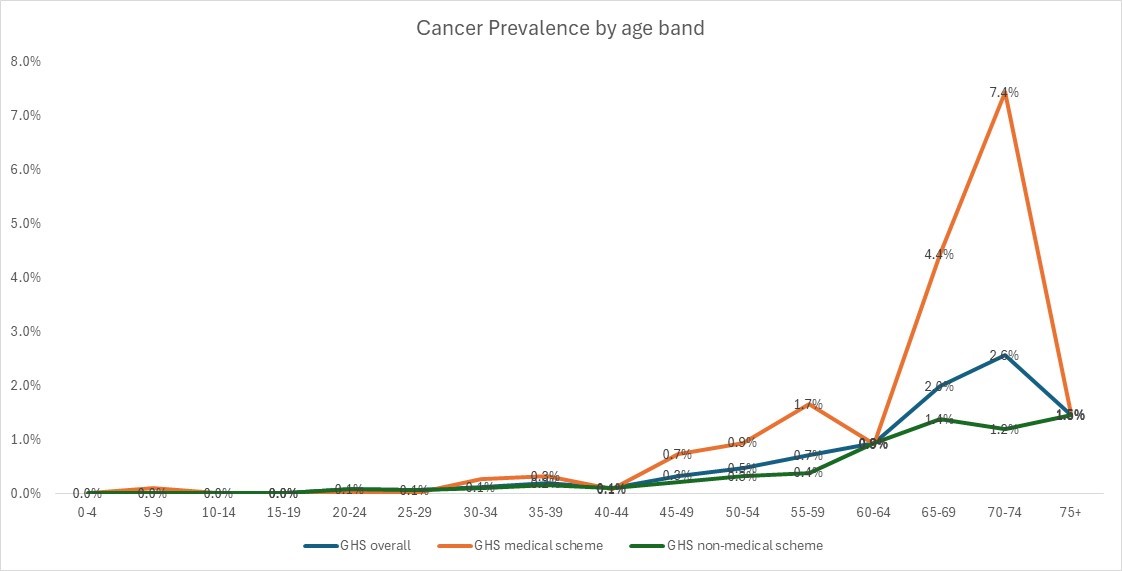
Figure 6: Cancer prevalence by age band in 2023.
Both before and after our data are adjusted for age, the medical scheme population has double the cancer prevalence of the non-medical scheme population. This suggests that people who have cancer are more likely to purchase or retain medical scheme membership. It may also indicate that medical scheme members are more likely to be aware of the need for, or be able to access cover for, cancer screening and so they may be diagnosed more often than are non-members.
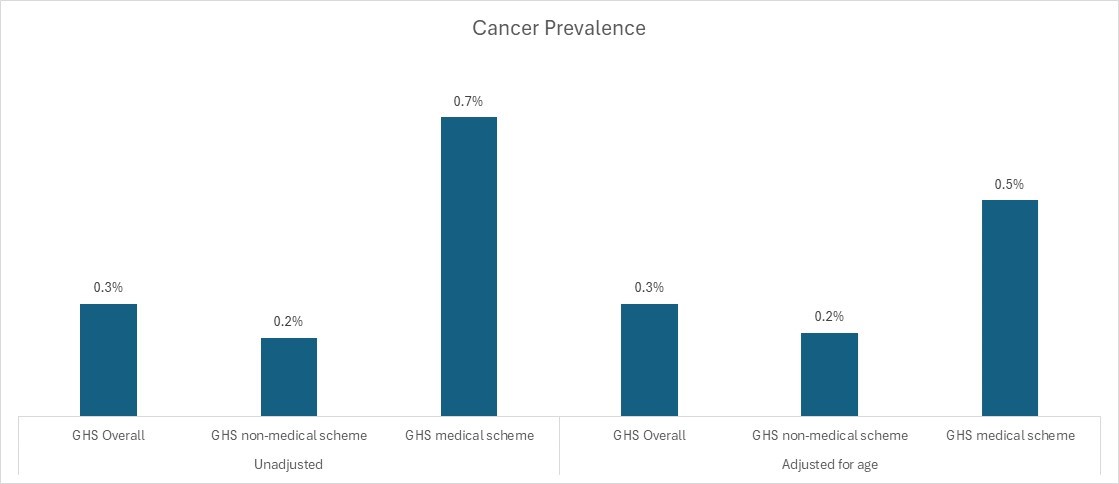
Figure 7: Cancer prevalence showing unadjusted vs adjusted for age differences (2023).
Cancer benefits provided by medical schemes vary by benefit option with comprehensive oncology cover in some options. People who have cancer may therefore seek or retain medical scheme cover to access the scheme's oncology benefits. Similarly, medical scheme members who do not have cancer may retain membership in case they develop the disease in future.
Also, cancer services provided by South Africa's public healthcare services vary by facility. In the public service comprehensive cancer care is compromised by a shortage of human resources, poor patient administration and support, and poor co-ordination of cancer services.4 5 6
GHS data highlights how asthma affects children and varies by coverage
The 2023 GHS data shows asthma prevalence is variable by age for medical scheme lives, with high prevalence in children. Asthma prevalence increases by age of the non-medical scheme population, and also of the medical scheme population but not as linearly.
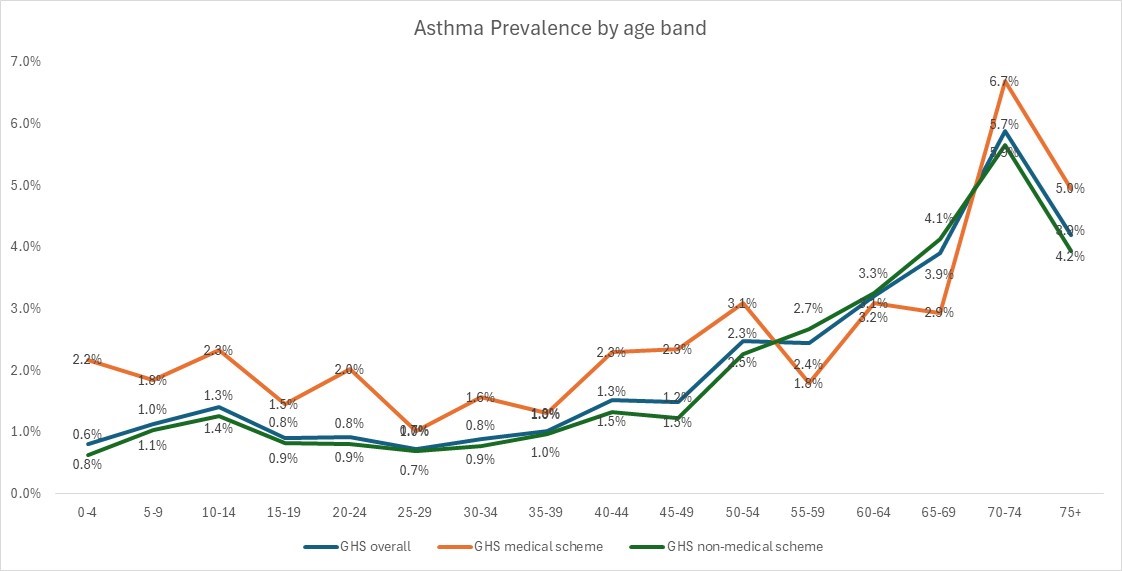
Figure 8: Asthma prevalence by age band in 2023.
Both before and after age-adjusting these data, the medical scheme population has a higher prevalence of asthma compared to the non-medical scheme population. The prevalence of asthma is 1.3%, both with and without age adjustment. However, the prevalence of asthma in the medical scheme population is almost double that of the non-medical scheme population at 2.2% (unadjusted) or 2.1% (adjusted) compared to 1.3% (non-scheme members).
It is possible that GHS survey respondents might not know the difference between asthma and other diagnosed respiratory conditions.
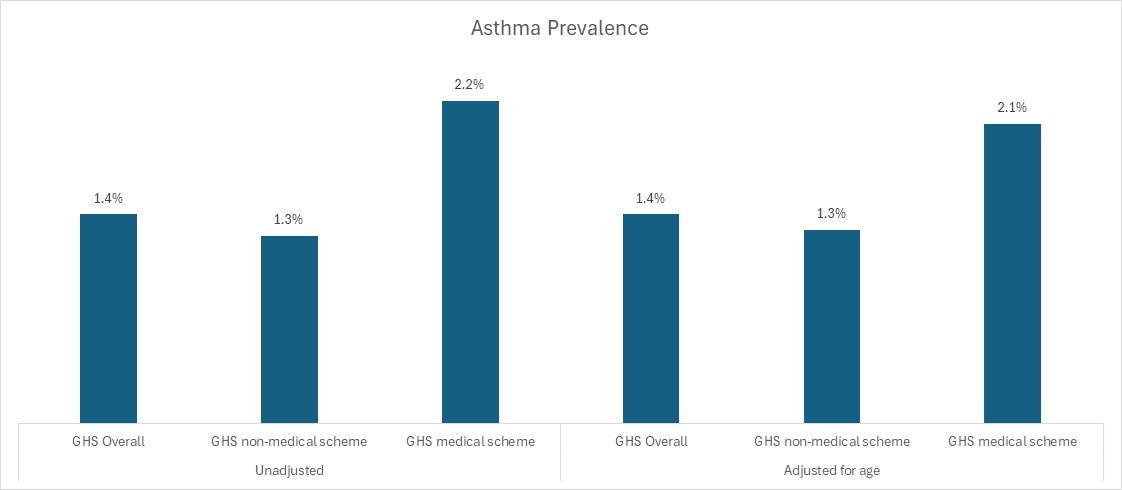
Figure 9: Asthma prevalence showing unadjusted vs age-adjusted data (2023).
Human Immunodeficiency Virus (HIV) and AIDS prevalence differ by age and coverage
The prevalence of HIV and AIDS for the total population, as reported in the 2023 GHS, increases significantly from 0.9% in the 20-24 age band to 7% in the 50-54 age band, and reducing thereafter for older ages.
- The prevalence of HIV and AIDS differs vastly between the medical scheme and non-medical scheme populations.
- Compared to the medical scheme population, non-scheme lives show more variation in HIV and AIDS prevalence by age.
- In the scheme population, there is some volatility in HIV and AIDS prevalence for older ages likely as a result of smaller population numbers with HIV and AIDS.
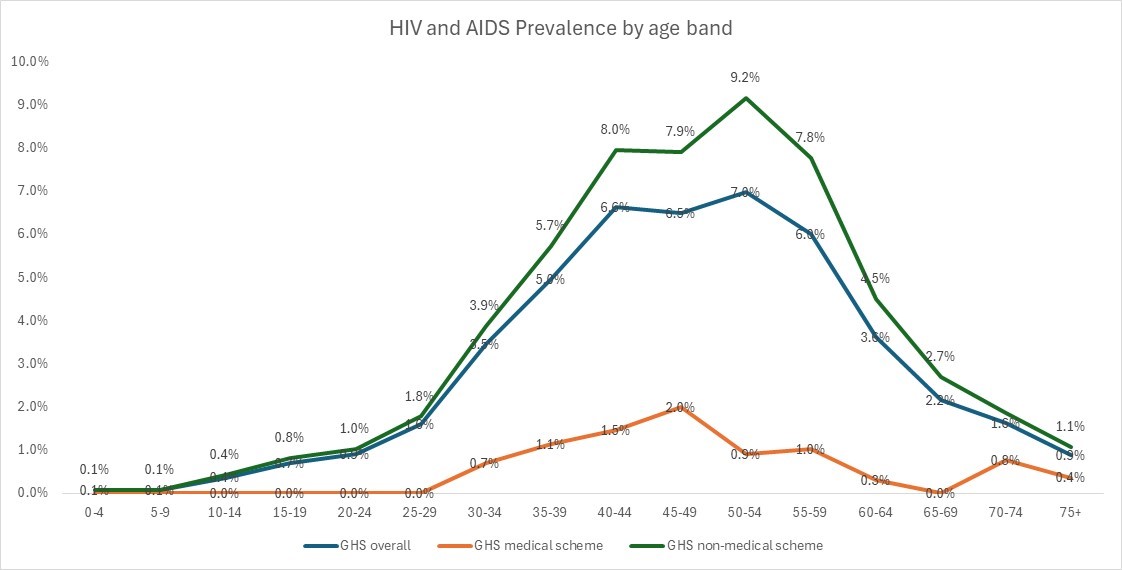
Figure 10: HIV and AIDS prevalence by age band in 2023
There are several possible reasons for the prevalence of HIV and AIDS being higher among non-medical scheme lives than for medical scheme lives:
- These data reflects a period of time when the majority of South Africa's HIV and AIDS treatment costs were funded both through donor funds and domestically, with screening, diagnosis and treatment of HIV and AIDS largely provided in the public sector through the extensive primary health clinic network.7
- The medical scheme population is also of a higher socioeconomic status than the non-scheme population and it is well known that HIV and AIDS prevalence is strongly associated with socioeconomic status .
- The GHS study is based on self-reported data and with this condition, there is a significant under-disclosure challenge due to a lack of awareness of or low willingness to disclose one's HIV or AIDS status8.
- The HIV and AIDS prevalence reported in the GHS data is low compared to actual HIV and AIDS prevalence rates in the country, which are estimated at 12.7%9. This highlights under-reporting of HIV and AIDS prevalence in the 2023 GHS study.
Both before and after age-adjusting these data, the non-medical scheme population reflects a higher prevalence of HIV and AIDS compared to the medical scheme population.
When adjusting for age, the prevalence of HIV and AIDS among the medical scheme population is 0.6% compared to 3.0% among the non-medical scheme population.
The result is similar without the adjustment (0.5% vs 3.1%).
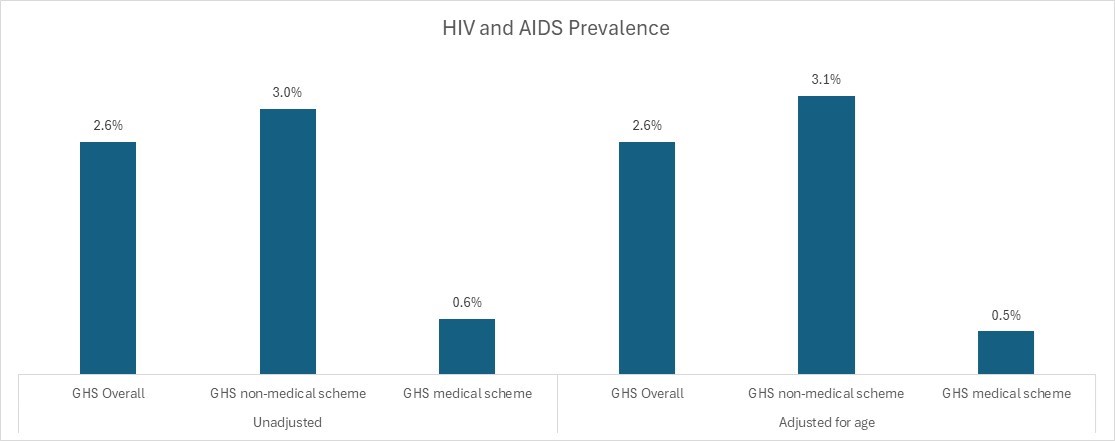
Figure 11: HIV and AIDS prevalence showing unadjusted vs adjusted for age differences (2023).
Conclusion
Our analysis of the 2023 GHS data shows that, measured from diabetes, hypertension, asthma, HIV and AIDS, and cancer prevalence levels, the medical scheme population has a higher disease burden than the non-medical scheme population.
This can be explained by the older age profile of the medical scheme population. Older and sicker lives tend to purchase and retain medical scheme cover to have access to the benefits. As younger lives, who tend to be healthier, delay joining or drop out of the medical schemes risk pool, the cost of cover for members to access the same benefits year-on-year increases - as the remaining population is relatively older and sicker.
As individuals age, the likelihood of developing one or more chronic conditions - especially NCDs - typically increases. So, older people tend to use more healthcare services. For medical schemes, this means increased claims costs year-on-year, as the member population ages. This is a core demand-side driver of medical inflation (how much more medical care and health services cost each year).
In large part this dictates how much medical scheme contributions (what members pay each month to belong to a medical scheme) increase by at the start of each year - not only for older members but for all members. Worldwide, medical inflation typically exceeds consumer price inflation by 3-4%. Medical scheme financial resilience and overall sustainability rely on contribution levels remaining aligned to projected costs for each coming year - which vary across plan options on a scheme.
Context: In September 2024 Discovery Health Medical Scheme (DHMS) announced contribution increases for 2025 (contribution rates increase annually for every medical scheme on the market) in line with projected medical inflation for 2025 - for DHMS driven by an increase in demand for healthcare services, to meet the needs of a gradually ageing scheme member base, and due to the increasing prevalence of chronic illness among Scheme members.
This analysis shows that even after adjusting for age differences between the medical scheme and non-medical scheme populations, there is a higher prevalence of diabetes, cancer, asthma and hypertension among the medical scheme population.
The prevalence of diabetes and hypertension is consistent between the medical scheme and non-medical scheme populations. - HIV and AIDS (two closely related conditions) show substantively lower prevalence in the medical scheme population compared to the non-medical scheme population.
Possible limitations of the 2023 GHS data landscape:
While the 2023 GHS provides a consistent set of data across population segments, it may feature under-reporting of disease as it relies on self-reporting of conditions.
It is also based on a sample of the population and therefore infers the remainder of the population's chronic condition prevalence levels from this sample.
Want to know more about the DHMS context?
Access our related articles on the impact of disease on Discovery Health Medical Scheme members: we've looked at cancer screening rates, diabetes, and mortality trends over time.
Acknowledgements
The authors would like to thank Discovery Health's Roseanne Harris (Head Of Policy And Regulatory Affairs at Discovery Health) and Sarika Besesar (Actuary) for their review of this article.
Interested in knowing more or reporting on these findings?
Please contact us on MEDIA_RELATIONS_TEAM@discovery.co.za to request any updated data available since publication and to obtain any further context required.
Did you find this post interesting?
Please visit our Discovery Health Insights Hub for a range of analyses and insights shared by our Discovery Health Intelligence Team over the past three and a half years and spanning a variety of health-related themes. All of our COVID-related analyses are posted under our "COVID-19 Insights" pillar.
All information shared on this page is based on perspectives gained from analysing data acquired by Discovery Ltd and its various affiliate entities (Discovery). The analysis, which is conducted by Discovery's actuarial and data science team, aims to encourage industry dialogue. Publications containing our analyses are shared for educational and informational purposes only. Each publication reflects only these data available for analysis at the time of publication. It does not, unless otherwise indicated, constitute peer-reviewed, published scientific research, and hence should not be interpreted as such or used as a basis for altering treatment decisions. While every effort has been made to ensure the accuracy of the content conveyed, we cannot be held liable or responsible for any actions or decisions taken based on the information shared in this article.
- 1Children are generally charged a lower contribution than adult members
- 2Reference: Statistics South Africa, General Household Survey, 2023. https://www.datafirst.uct.ac.za/dataportal/index.php/catalog/961
- 3Najafi, M. Moradinazar, Hamzeh,and S. Rezaeian. The reliability of self-reporting chronic diseases: how reliable is the result of population-based cohort studies. https://www.ncbi.nlm.nih.gov/pmc/articles/PMC6953454/
- 4 5 6Barriers to Accessing Oncology Services for Effective Cancer Care in the Public Health Institutions in Limpopo Province, South Africa: A Qualitative Study, https://www.ncbi.nlm.nih.gov/pmc/articles/PMC10366909/ Somdyala NI, Bradshaw D, Gelderblom WC, et al.. Cancer incidence in a rural population of South Africa, 1998-2002. Int J Cancer 2010;127:2420-9. 10.1002/ijc.25246 Section27. (2025). Section27 and Cancer Alliance welcome court judgment on the provision of lifesaving radiation oncology treatment for thousands of cancer patients. [online] Available at: https://section27.org.za/2025/03/section27-and-cancer-alliance-welcome-court-judgment-on-the-provision-of-lifesaving-radiation-oncology-treatment-for-thousands-of-cancer-patients
- 7L. C. Long, S. Girdwood, K. Govender, G. Meyer-Rath & J. Miot (2023). Cost and outcomes of routine HIV care and treatment: public and private service delivery models covering low-income earners in South Africa Cost and outcomes of routine HIV care and treatment: public and private service delivery models covering low-income earners in South Africa https://bmchealthservres.biomedcentral.com/articles/10.1186/s12913-023-09147-7
- 8Bunyasi EW, Coetzee DJ. Relationship between socioeconomic status and HIV infection: findings from a survey in the Free State and Western Cape Provinces of South Africa. BMJ Open 2017;7:e016232. doi: 10.1136/bmjopen-2017-016232; Igulot P, Magadi MA. Socioeconomic Status and Vulnerability to HIV Infection in Uganda: Evidence from Multilevel Modelling of AIDS Indicator Survey Data. AIDS Res Treat. 2018 Jun 7;2018:7812146. doi: 10.1155/2018/7812146. PMID: 29983999; PMCID: PMC6011175. ; Cindy Leung Soo, Nitika Pant Pai ,Susan J. Bartlett, Aliasgar Esmail, Keertan Dheda, Sahir Bhatnagar
- Socioeconomic factors impact the risk of HIV acquisition in the township population of South Africa: A Bayesian analysis. Published: January 26, 2023. https://doi.org/10.1371/journal.pgph.0001502 ; Association between socio-economic factors and HIV self-testing knowledge amongst South African women
- Michael Ekholuenetale, Chimezie I. Nzoputam, Osaretin C. Okonji. Received: 16 Nov. 2021; Accepted: 03 Jan. 2022; Published: 24 Mar. 2022 ;
- Wabiri, N., Taffa, N. Socio-economic inequality and HIV in South Africa. BMC Public Health 13, 1037 (2013). https://doi.org/10.1186/1471-2458-13-1037 Human Sciences Research Council (HSRC). (2023). South African National HIV Prevalence, Incidence, Behaviour and Communication Survey (SABSSM VI). Pretoria: HSRC. Available at: https://hsrc.ac.za/wp-content/uploads/2023/11/SABSSMVI-SUMMARY-SHEET-2023.pdf [Accessed 17 April 2025].
- 9Human Sciences Research Council (HSRC). (2023). South African National HIV Prevalence, Incidence, Behaviour and Communication Survey (SABSSM VI). Pretoria: HSRC. Available at: https://hsrc.ac.za/wp-content/uploads/2023/11/SABSSMVI-SUMMARY-SHEET-2023.pdf [Accessed 17 April 2025].