Here’s why your retirement nest egg may be failing to hatch

Do you think a money market account is a safer place for your retirement savings than the stock market? Or that it’s a good idea to seek out the fund management firm with the lowest fees? Wrong. These and other myths about retirement saving are costing you more than you think.
A study by Vanguard showed that individuals with financial advisers achieved on average about 3% higher returns a year than those who did not take professional advice. The reason for this is that people are not always as good as they think at managing their own retirement investments. For amateur investors, it is all too tempting to try to time the market, pick the best fund manager on the basis of recent performance or choose the cheapest fund manager.
Financial advisers help their clients avoid the pitfalls of believing some common misconceptions. If you’ve been trying to “go it on your own”, you may be guilty of some of them. Let’s examine a few of the most predominant of these misconceptions.
Myth 1: Shares are riskier than money market
Most investors understand that investment or market risk is defined as volatility of investment returns. So they conclude that investing in equity (listed shares) represents the greatest risk and an investment in cash the lowest risk. Over the past three years, the annualised volatility of returns from equity, at 11.31%, was 54 times more than that of cash, at 0.21%. So, yes, investing in equities is more volatile.
But for investors with a long-term investment horizon (like someone saving towards retirement), who only require access to their money far in the future, the truth is that investing only in cash poses the most risk and equity the least risk. This is because your ultimate goal is to protect the purchasing power of your savings and to grow it, in other words, beat inflation over the long term.
The following graph shows that for investment terms of six years or more, historically the worst equity returns over such a period beat the best possible returns from cash investments. In fact, for an investment term of ten years, an equity investment would beat a cash investment by 16.05% - even in the worst-case scenario.
The lowest annualised local equity returns versus the highest annualised local cash returns over different investment terms
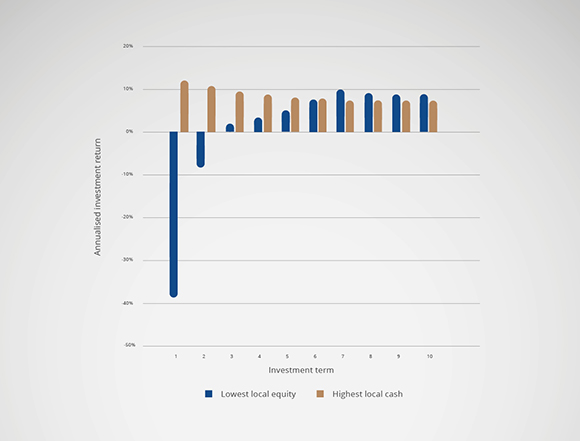
Source: Morningstar to end of December 2018
This means that investing too conservatively over a long investment period comes at a serious cost. Historical data shows it’s essentially more risky to be too conservative when investing because even in the worst scenarios, your investment would significantly underperform.
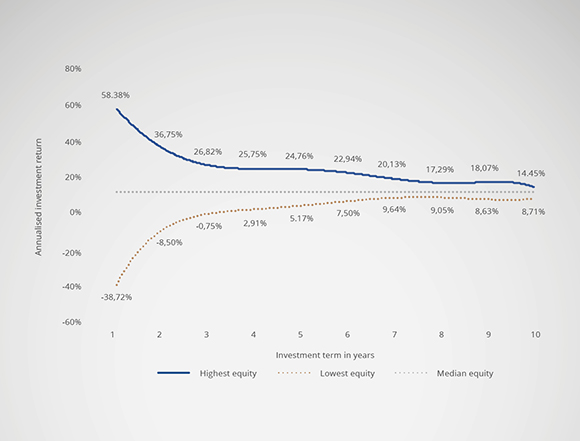
This is because although equity is riskier in the short term, over the long term the expected returns are much larger than cash and the volatility of long-term investment outcomes becomes smaller. This can be seen in the following graph, which shows the maximum and minimum equity returns over different investment periods historically.
Maximum and minimum historical local equity returns versus the median return over different investment horizons
Of course, there are other issues to take into account when comparing equity with money market investments, such as tax and liquidity (which refers to how quickly you can access your money). A professional adviser would be able to explain all those implications, taking your particular situation into account.
Myth 2: Funds that charge lower fees will outperform those with higher fees
A common misconception is that, by picking the most cost-effective fund, investors will maximise their returns. However, this view assumes that all funds deliver the same investment returns before fees, which simply isn’t true. More detailed research shows that the relationship between performance and fees is very low.
If we compare the annualised returns of the Association for Savings and Investment South Africa (ASISA) Multi-Asset High-Equity sector in the ten years to 2018 with the management fees of those funds in 2008, the correlation is negative 0.21, which means there is no clear relationship between performance and fees.
Even more important is the divergence of performance. The total expense ratio (TER) of an investment fund gives an investor an indication of the total fees of that fund. If we compare a relatively high-cost fund (TER of 2.47% in 2008) with a relatively low-cost fund, (TER in 2008 of 1.41%), the ten-year return from the more expensive fund was 77% higher than that of the less expensive fund.
The graph below shows the difference in performance between a high-cost fund and a low-cost fund.
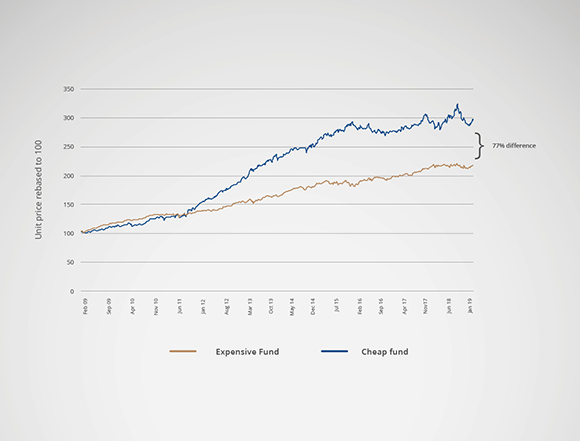
Our research shows that the impact of fees tends to be less when a fund has a larger allocation to growth assets, such as local and global equity. This is because talented equity asset managers can analyse a range of top-performing companies and pick the right stocks. Those talented managers may often work for the management companies charging higher fees. A management company that can afford to invest in research and reward its top fund managers may well have an advantage over its competitors.
Myth 3: Last year’s best-performing fund will be next year’s top fund, too
Many investors base their choice of fund manager on recent performance figures and assume that fund managers that had the best returns in the past will continue to deliver the best returns in the future. Their error is to look only at one or two performance periods, rather than long-term consistency of performance.
The truth is, relative performance can change significantly from one period to another and so can fund rankings in each sector. For example, looking at the one-, three- and five-year performance periods for funds in the ASISA Multi-Asset High-Equity sector for the period ending 31 December 2018, a fund with top-quartile performance over all periods is shown in the following chart:
Top quartile fund overall performance periods ending 31 December 2017
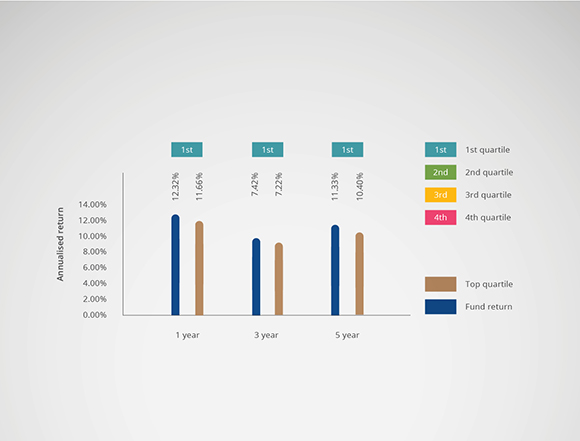
Based on those rankings, most investors would conclude that the fund is likely to repeat its outperformance, and would seriously consider investing in it over the long term.
But a year later, that fund’s relative performance changed dramatically. The graph below shows the quartile performance for the same measurement periods as at 31 December 2018.
Mixed relative performance of the same fund for periods ending 31 December 2018
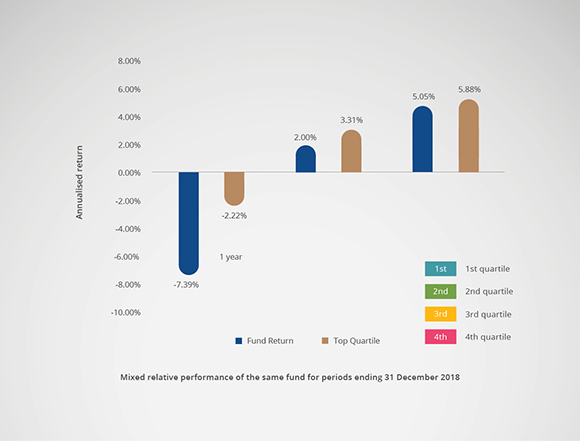
An investor who invested in this fund based on 31 December 2017 performance figures ended up with an underperforming fund. A more reliable indicator of whether an investment manager is among the best in the sector is to assess the consistency of relative returns, based either on ranking, percentile or the quartile of investment returns of a fund within a certain ASISA sector.
An indication of exceptional asset-management ability would be an asset manager who has achieved top-quartile performance (better than 75% of other funds in the same sector) on a consistent basis. For example, an investor who wants to ensure that they have chosen the fund manager that performs the most consistently over a five-year period, would need to look at their track record for every five-year period since inception. The fund with the most five-year returns within the top and second quartile would therefore be the most consistently performing fund.
Myth 4: You can move savings into money market to avoid a crash
Although saving for retirement is a long-term game, some investors maintain the belief that they are able to switch their equity investments into cash before equity markets experience a downturn, and then switch back into equity to benefit from market growth. We’ve seen that when investors try to do this, they rarely get their timing right. Let’s look at a specific example:
Based on the performance of the South African Multi-Asset High-Equity sector relative to the ASISA Money Market sector, investors would have been better off investing in a money market fund between 1 January 2018 and 31 May 2018, and between 1 September 2018 and 30 November 2018. They would have been better off investing in equity between 1 June 2018 and 31 August 2018, and between 1 December 2018 and 28 January 2019. The graph below shows this.
Monthly returns of the South African Multi-Asset High-Equity sector vs the South African Interest-Bearing Money Market from 1 January 2018 to 28 February 2019

If investors were timing the market well, they would be switching into cash during January/February, back into equity in June, then into money market in September and back into equity in December. But our data shows that our clients didn’t do that – in fact the behaviour was most often in the opposite direction. The following graph shows how investors mistimed their switches from one sector to another between 1 January 2018 and 28 February 2019.
Net monthly switches of clients on the Discovery Invest platform between the South African Multi-Asset High-Equity sector and the South African Interest-Bearing Money Market sector
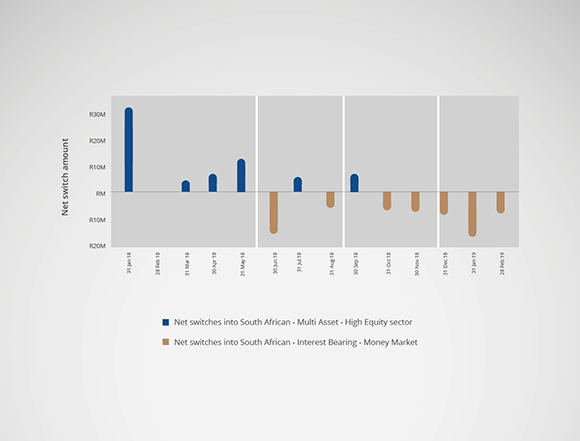
Investors switched their proceeds into equity whenever the sector experienced negative performance and kept switching into money market funds during periods of superior equity performance. Furthermore, they failed to switch back into equity whenever equity performed well.
Due to the mistiming of switches, investors achieved on average an investment return of -0.62% over the period 1 January 2018 to 28 February 2019. They would have been better off staying where they were.
Conclusion
When falling for these common investment myths, investors can end up with not only lower returns, but even negative returns. A good financial adviser can help investors avoid the pitfalls of these myths, while maximising their returns based on their individual needs analysis..
Retiring later, saving more and spending less in retirement make the biggest impact on ensuring you have enough to live on for the rest of your life after you stop working. These are all relatively easy to do – and far easier to do with a financial adviser than trying to plot a route through volatile markets with too little information.
Investors can also choose an investment provider that rewards them for healthy financial behaviour. Discovery’s Retirement Annuities reward you for investing longer, investing more, living well and withdrawing wisely in retirement. By saving earlier, retiring later and not cashing in your retirement savings when you change jobs, you can earn up to 20% extra on your initial investment. By adding more to your savings every now and then (such as your bonus), you can get up to 30% extra. Following a healthy lifestyle, driving more safely and being prudent with money can earn you up to 2% extra returns on your savings. Once you retire, preserving your savings by withdrawing only what you need and living a healthy lifestyle can earn you up to 50% extra on your lifetime income.
All graphs displayed in this article is for illustrative purposes only. This article is meant only as information and should not be taken as financial advice. For tailored financial advice, please contact your financial adviser. Discovery Life Investment Services Pty (Ltd): Registration number 2007/005969/07, branded as Discovery Invest, is an authorised financial services provider. All life assurance products are underwritten by Discovery Life Ltd. Registration number: 1966/003901/06. An authorised financial service provider and registered credit provider, NCA Reg No. NCRCP3555. Product rules, terms and conditions apply. The views expressed in this article are those of the author and may not necessarily represent those of Discovery Invest