The Pareto Principle in healthcare: How the Top 1% of claimants account for 33% of Discovery Health Medical Scheme claims costs

A small share of members drives a large share of costs. This analysis shows how the Top 1% of Discovery Health Medical Scheme claimants account for 33% of claims spend, driven by age, multimorbidity and intensive hospital care.
Authors
Members of Discovery's Health Intelligence Team: Sayuri Naidoo (Actuarial Analyst), Katherine Tregoning (Actuary), Claudia Pastellides (Actuary), Ismail Rasool (Chief Data Officer), Lara Wayburne (Chief Health Intelligence Actuary)
Quick overview
The Pareto Principle, also known as the '80/20 Rule', reflects that in certain situations 80% of outcomes are caused by only 20% of inputs. Applied generally, this means a large percentage of effects comes from a small percentage of causes. While the numbers vary from context to context, the idea is that causes and outcomes aren't evenly distributed.
For medical schemes, this effect is pronounced: the Top 20% of Discovery Health Medical Scheme claimants account for 94% of Scheme healthcare costs. The Pareto Principle is in fact even more evident at the extremes where we see cost per member increase exponentially: the Top 10% of claimants account for 81% of Scheme claim costs and the Top 5% of claimants for 65% of costs. Also, the Top 1% of claimants (around 29,000 members) account for as much as 33% of overall Scheme spend. People with complex health needs account for a large share of healthcare utilisation and costs, and healthcare system resourcing and responsiveness is concentrated around their needs.
This article delves into the Top 1%, exploring their demographics, healthcare conditions, and care utilisation patterns both in and out of hospital.
The Pareto Principle
The Pareto Principle originated in the early 1900s with Italian economist Vilfredo Pareto. He noted that 20% of the pea pods in his garden produced 80% of the peas. Considering income distribution, he noted that 80% of land in Italy was owned by 20% of the population1. Around four decades later, engineer and management consultant Joseph Juran coined the 'Law of the Vital Few' - or Pareto Principle, also known as the 80/20 Rule - in which a small proportion of inputs drives a large proportion of outputs (Figure 1).
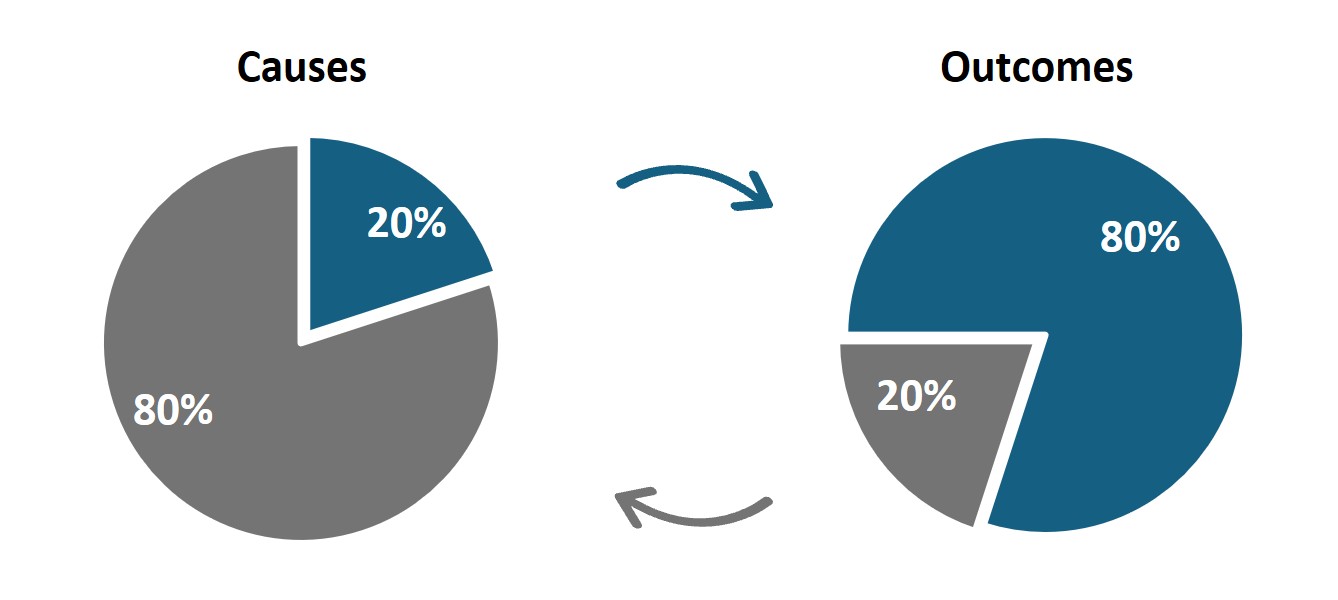
Figure 1: The Pareto Principle Visualised
The Pareto Principle was later formalised as a statistical distribution, known as the Pareto distribution (Figure 2), characterised by a long tail that shows how effects are distributed. Typically, extreme outliers are many multiples higher than the majority of effects, highlighting the significant benefit of focusing on the few inputs driving the majority of outcomes.
1Pareto, Vilfredo (1896 to 1897). Cours d'Économie Politique (in two volumes). F. Rouge (Lausanne) & F. Pichon (Paris). Volume 1 Volume
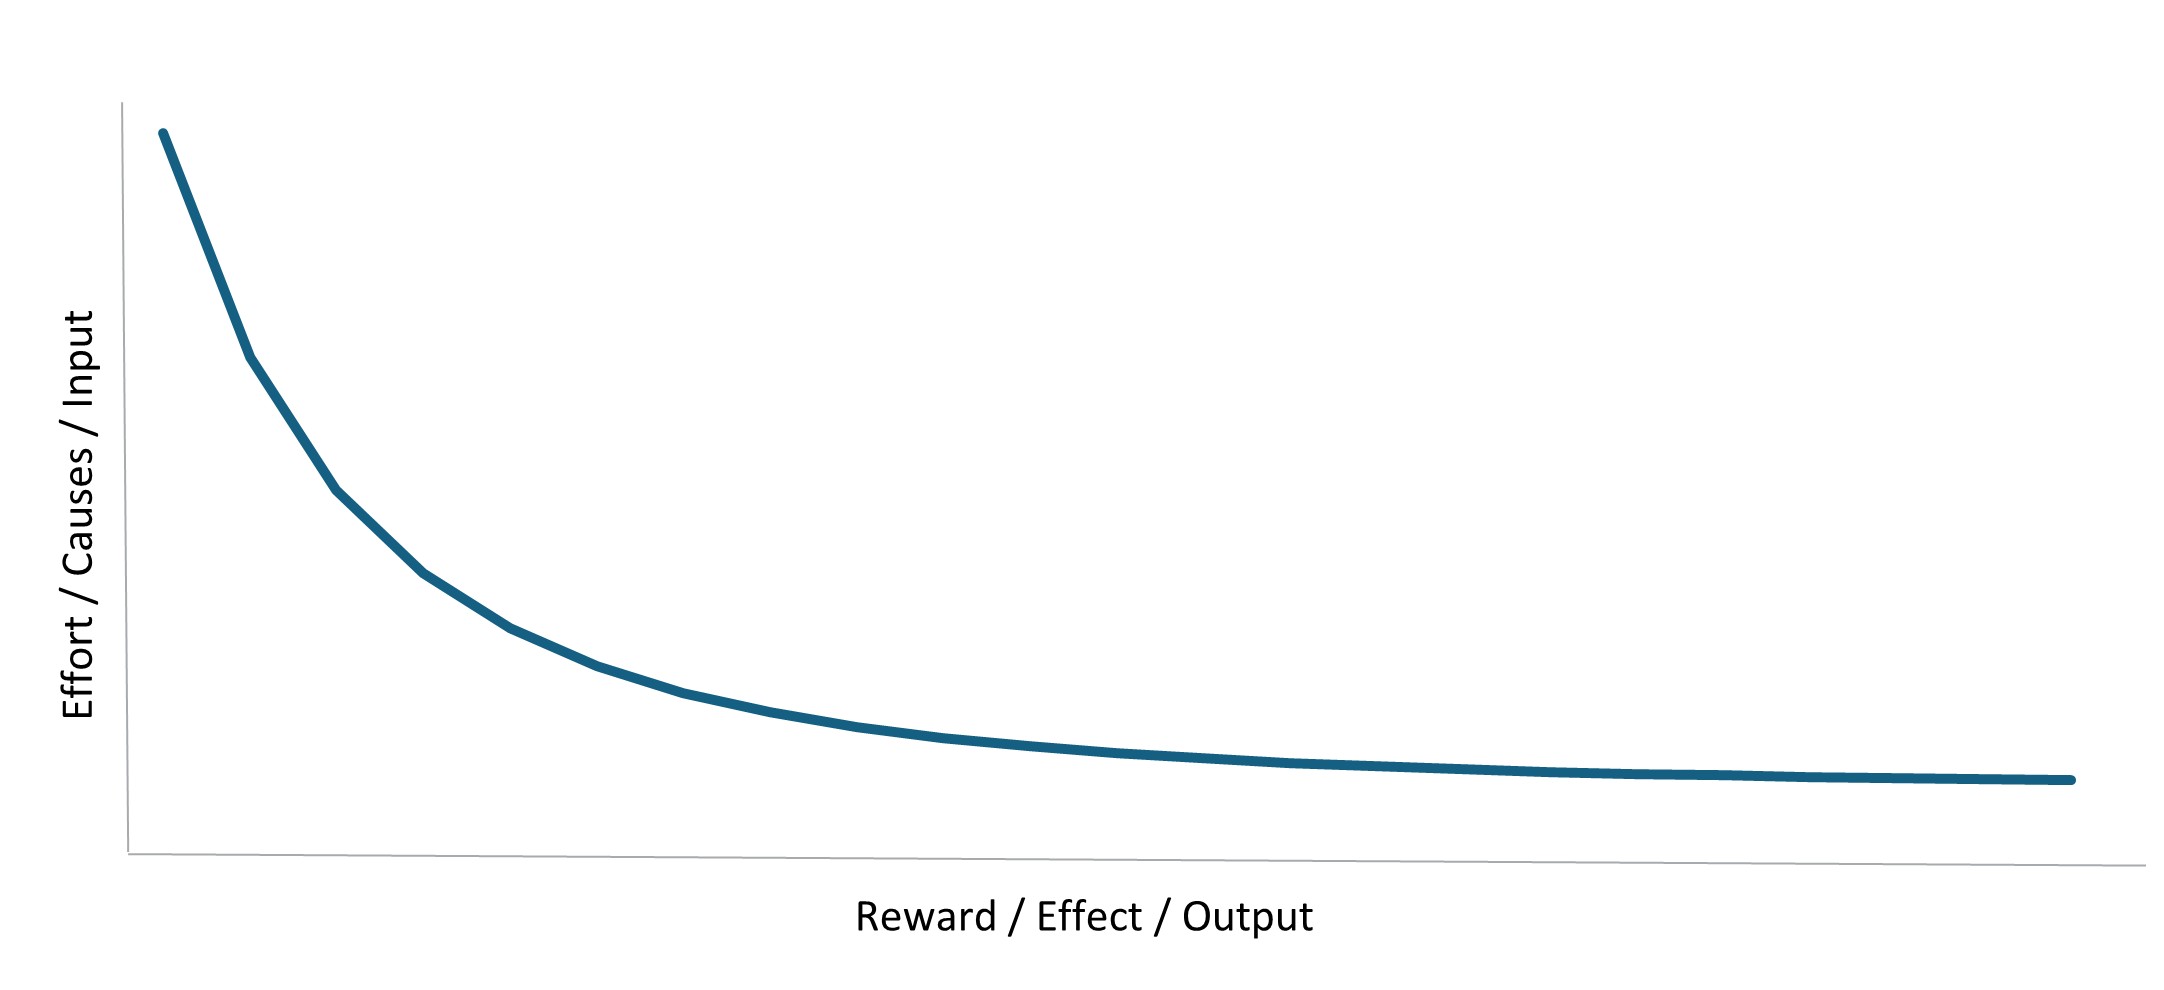
Figure 2: Statistical distribution depicting the Pareto Principle
The Pareto Principle in Discovery Health Medical Scheme members' claims experience
In this article, we show that the Pareto Principle is evident in healthcare, where the Top 20% of highest‑costing Discovery Health Medical Scheme (DHMS) claimants account for the majority of Scheme spend at 94%, the Top 10% of claimants account for 81% of Scheme spend, and the Top 1% of highest‑costing DHMS claimants account for as much as 33% of Scheme spend.
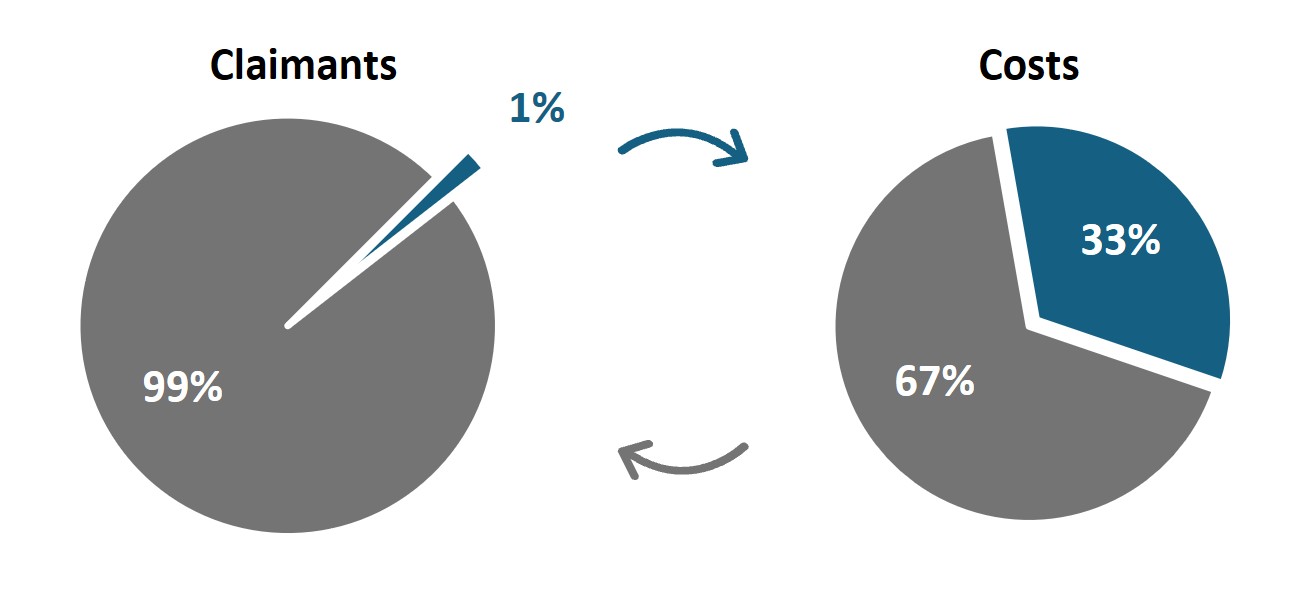
Figure 3: The Pareto Principle in DHMS
The distribution of healthcare costs clearly follows a Pareto distribution, as depicted by the long tail in Figure 4 below. The tail corresponds to the fact that a small proportion of claimants are extremely high costing, contributing a significant proportion to overall Scheme costs. The shaded area under the curve reflects total Scheme costs, with the various regions indicating the proportion of Scheme costs relating to the different cohorts of members. The blue shaded area represents the Top 20% cohort, accounting for 94% of Scheme costs, and the gold shaded area represents the Top 1%, accounting for 33% of Scheme costs. This highlights 'the tail within the tail' that is evident in the distribution of healthcare costs.
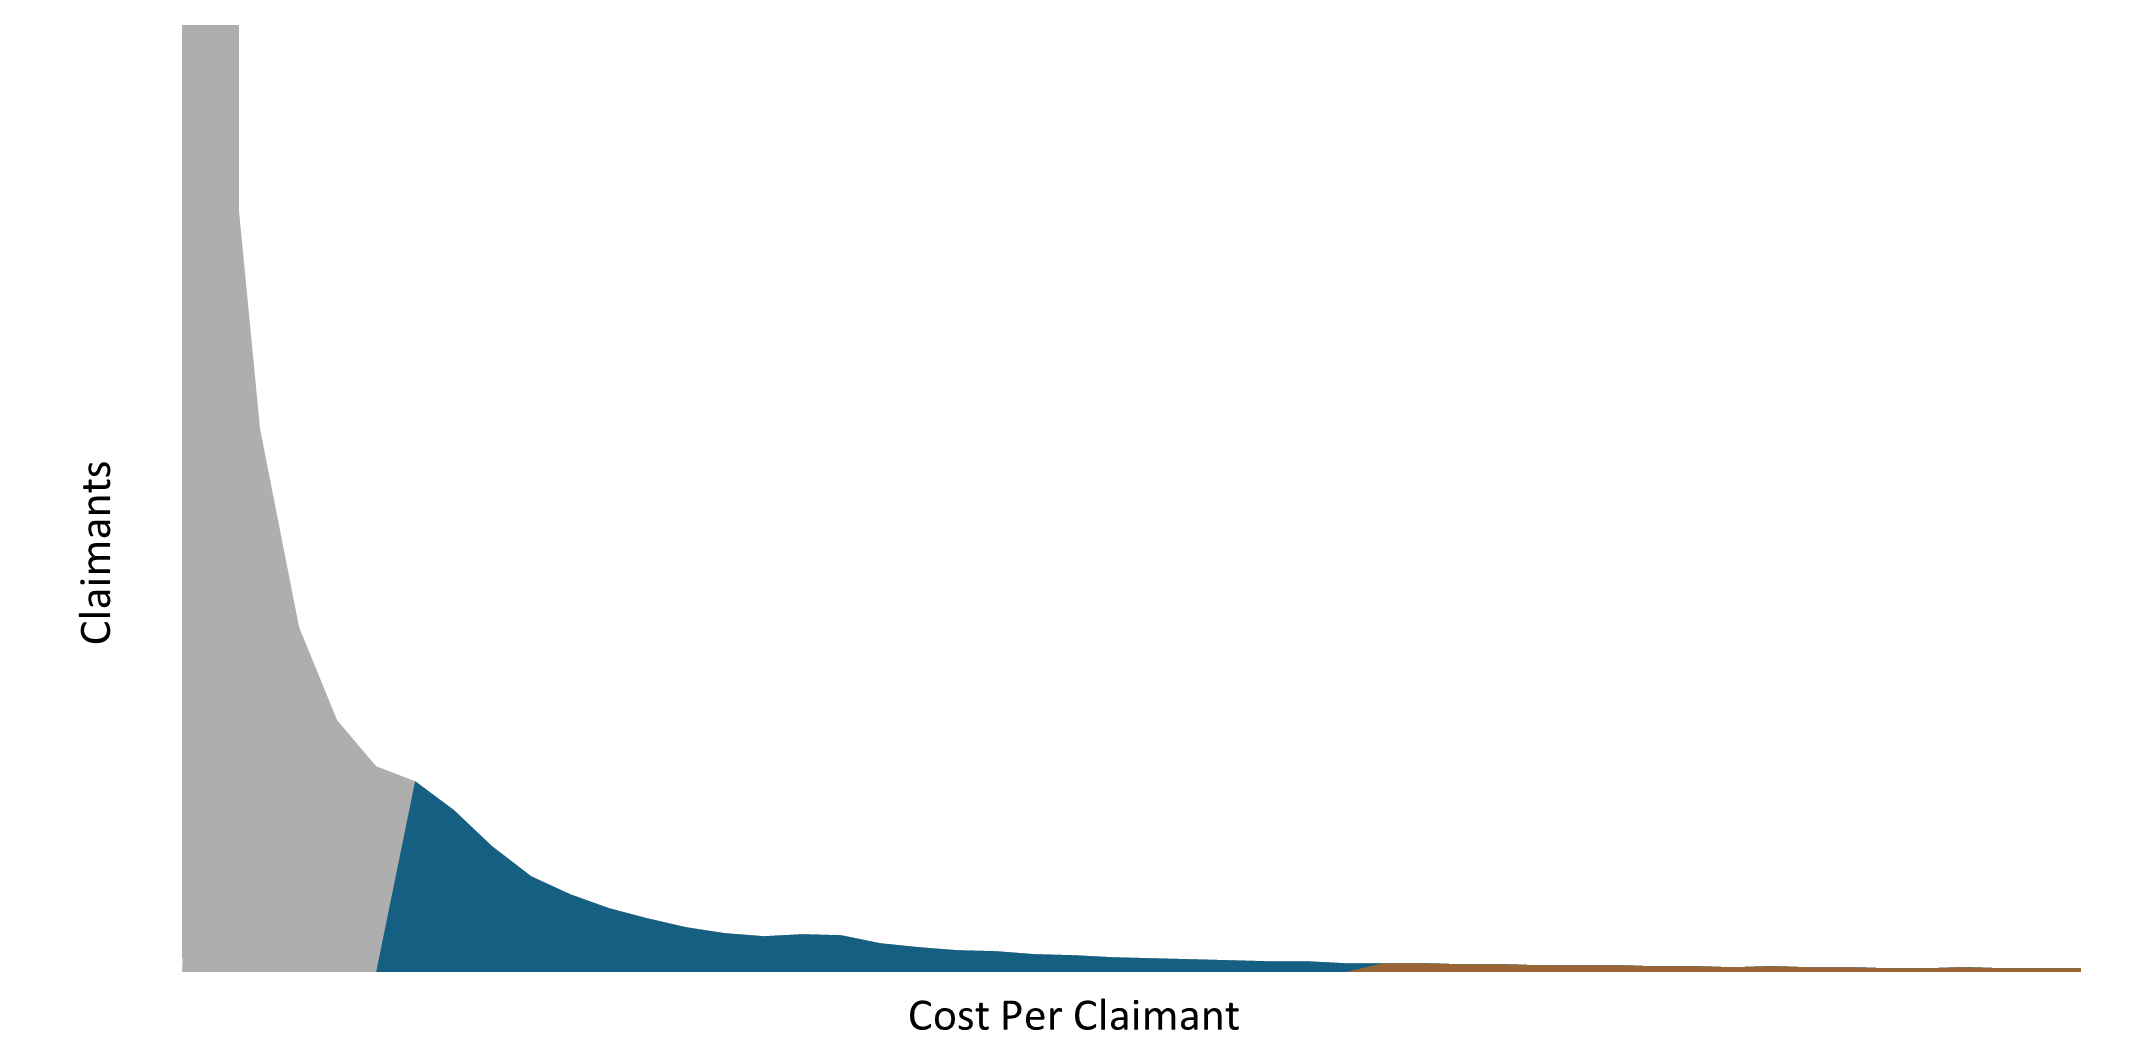
Figure 4: Pareto distribution of DHMS costs and claimants in 2024
Please note that the cost per claimant is truncated in Figure 4. The cost per claimant extends to extreme outlier values.
This skewed distribution of costs is expected to occur in any medical scheme. The South African healthcare environment is characterised by open enrolment and community rating. Open enrolment means that any individual can join an open medical scheme, like DHMS, and community rating means that all members pay the same contribution for the same level of benefits, regardless of their demographic profile and health status.
Within this funding structure of risk pooling across the covered population, healthier members cross‑subsidise sicker members. Therefore, medical schemes require a relatively large proportion of healthier members to subsidise a smaller group of sicker members. This is evident within DHMS where healthy members comprise 50% of members and account for only 10% of healthcare costs. These healthy members cross‑subsidise the Top 1% of highest‑costing claimants who, on average, cost DHMS 152 times more than a healthy member does.
The impact of age on the Top 1% cohort
Top 1% claimants tend to be older than the rest of the Scheme members on average, underscoring the impact of age on healthcare costs as a key theme in this cohort. The average age of a Top 1% claimant was 60 in 2024, compared with an average age of 37 for the overall Scheme. As illustrated in Figure 5 below, more than half of the Top 1% cohort is over 65, compared with only 14% for the overall membership.
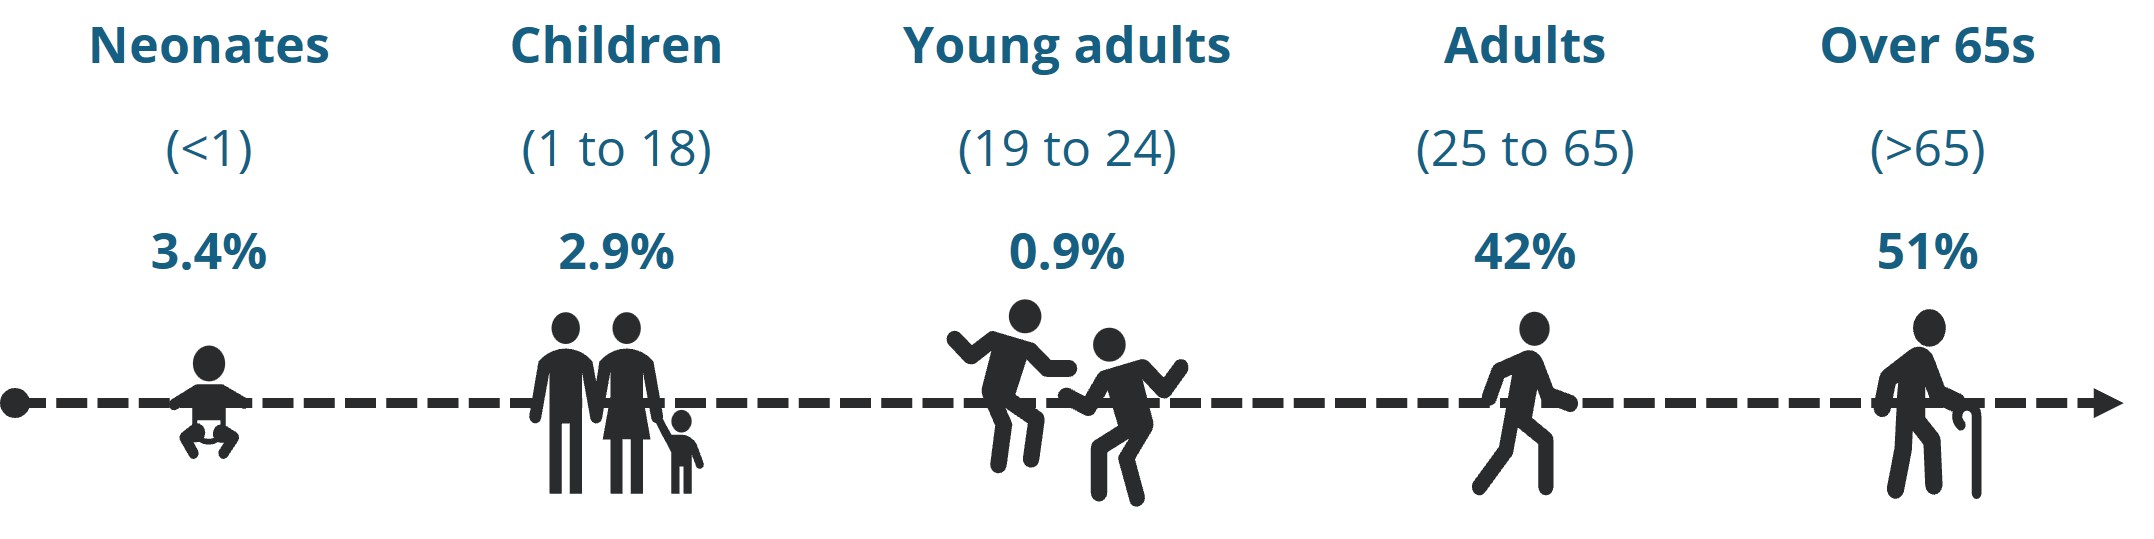
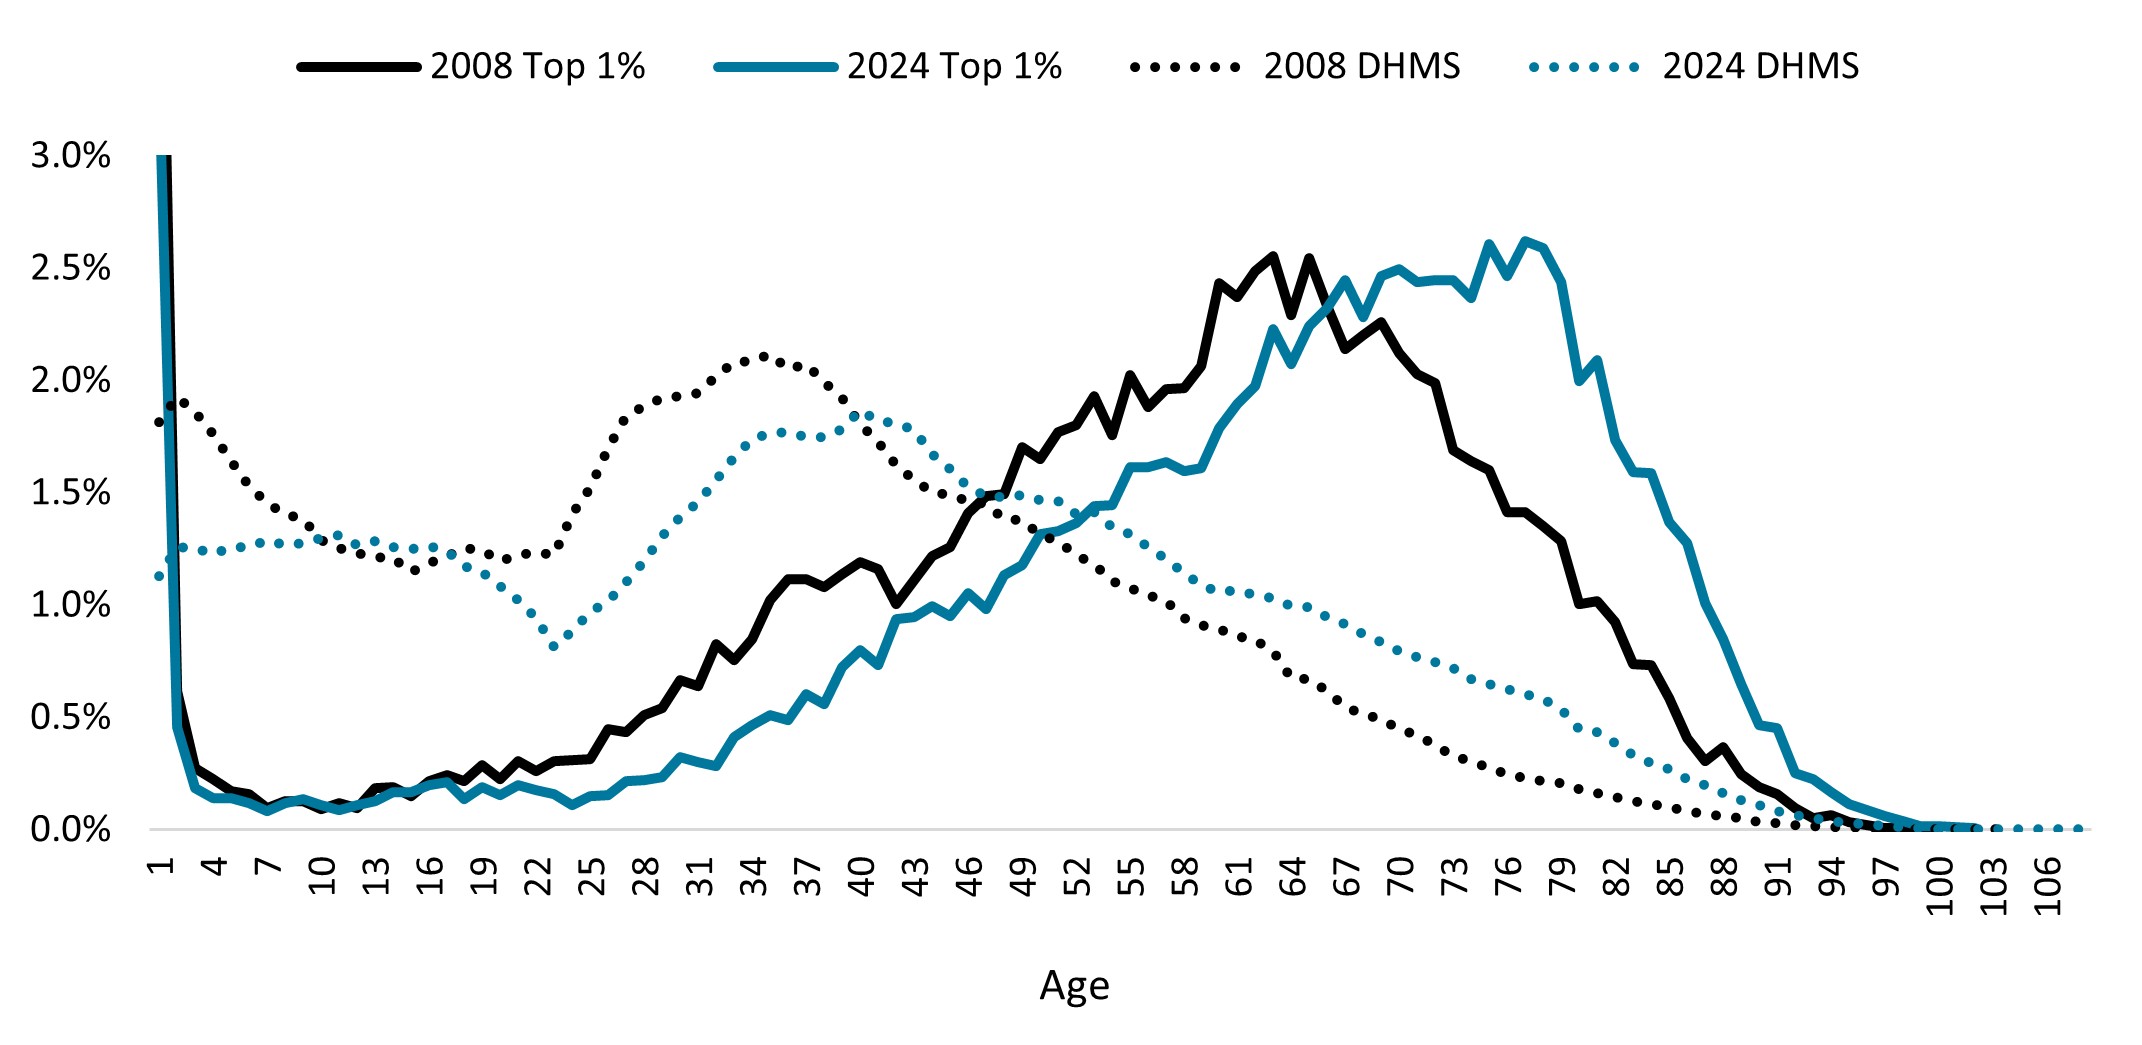
Figure 5: Age distribution of the Top 1% cohort
Increasing multimorbidity of the Top 1% cohort
The healthcare needs of Top 1% claimants are also becoming increasingly complex over time. Multimorbid members are those with multiple chronic conditions, including conditions listed on the Chronic Disease List2, or registration for the Oncology Benefit for cancer or for out‑of‑hospital Prescribed Minimum Benefits for depression3. Figure 6 below illustrates that 79% (almost four in five) of our Top 1% cohort in 2024 had a combination of various chronic conditions, compared with only 53% in 2008. This growing multimorbidity highlights the intensity of care these members need.
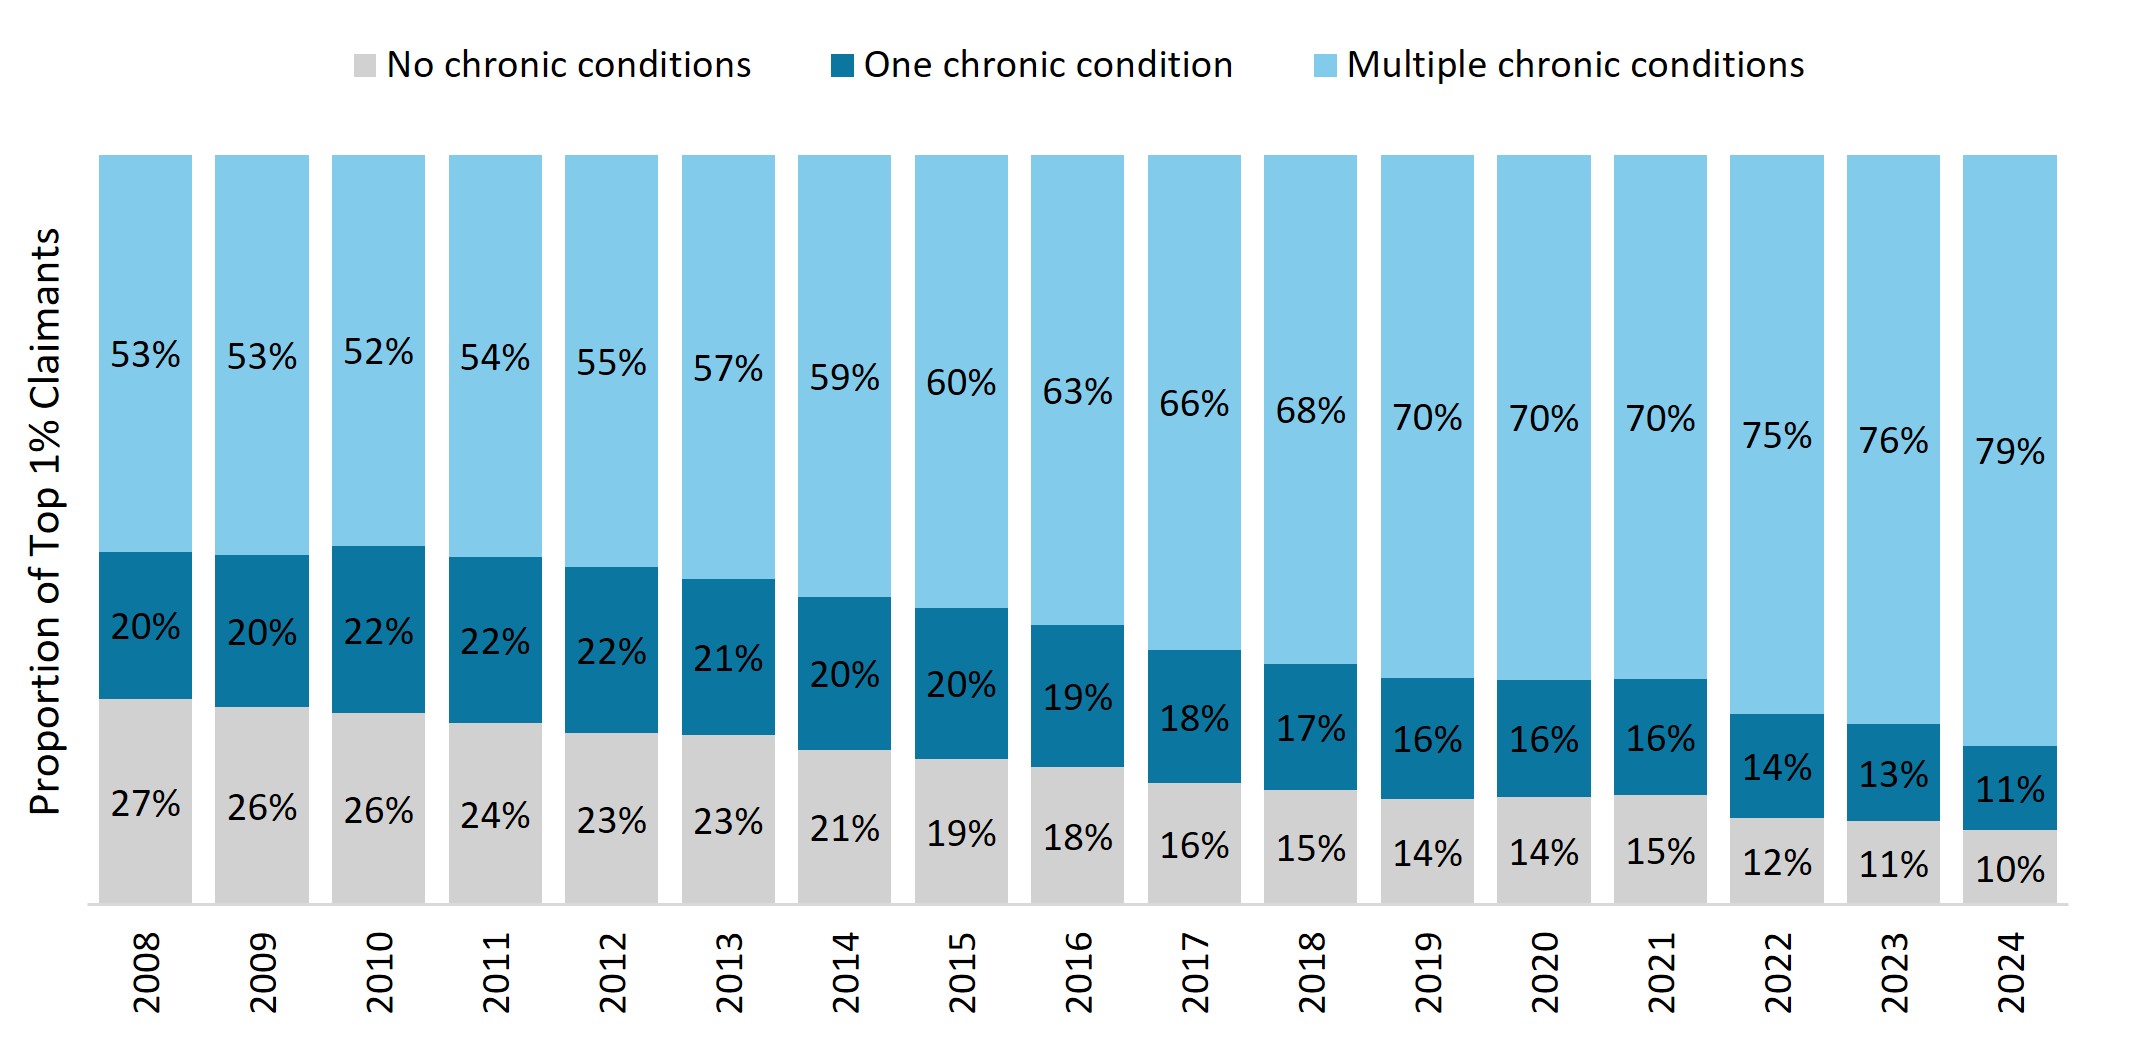
Figure 6: Distribution of the Top 1% claimants by chronic status over time
There are increasingly more members with cardiometabolic (diabetes and cardiovascular) conditions, cancer and dialysis treatment in this cohort over time. As shown in Figure 7, 70% of the Top 1% cohort had a cardiometabolic condition, 32% had a cancer diagnosis, and 12% were on dialysis treatment in 2024. Top 1% claimants have a three times higher prevalence of cardiometabolic conditions, 10 times higher prevalence of cancer, and 29 times higher prevalence of dialysis treatment than the overall Scheme membership.
2The Chronic Illness Benefit covers medicine for conditions listed on the Prescribed Minimum Benefit Chronic Disease List for all benefit options. The Chronic Illness Benefit covers a specified list of the consultations, procedures and tests needed to diagnose and manage these conditions. Prescribed Minimum Benefits are a set of minimum benefits that, by law, must be provided to all medical scheme members. This includes the diagnosis, treatment and cost of ongoing care for a list of conditions defined in the Medical Schemes Act 131 of 1998.
3DHMS members living with depression can apply for the out of hospital diagnosis and treatment set of the Prescribed Minimum Benefits basket of care for depression. This means they can have 15 out of hospital consultations or 21 days of in hospital psychiatric treatment.
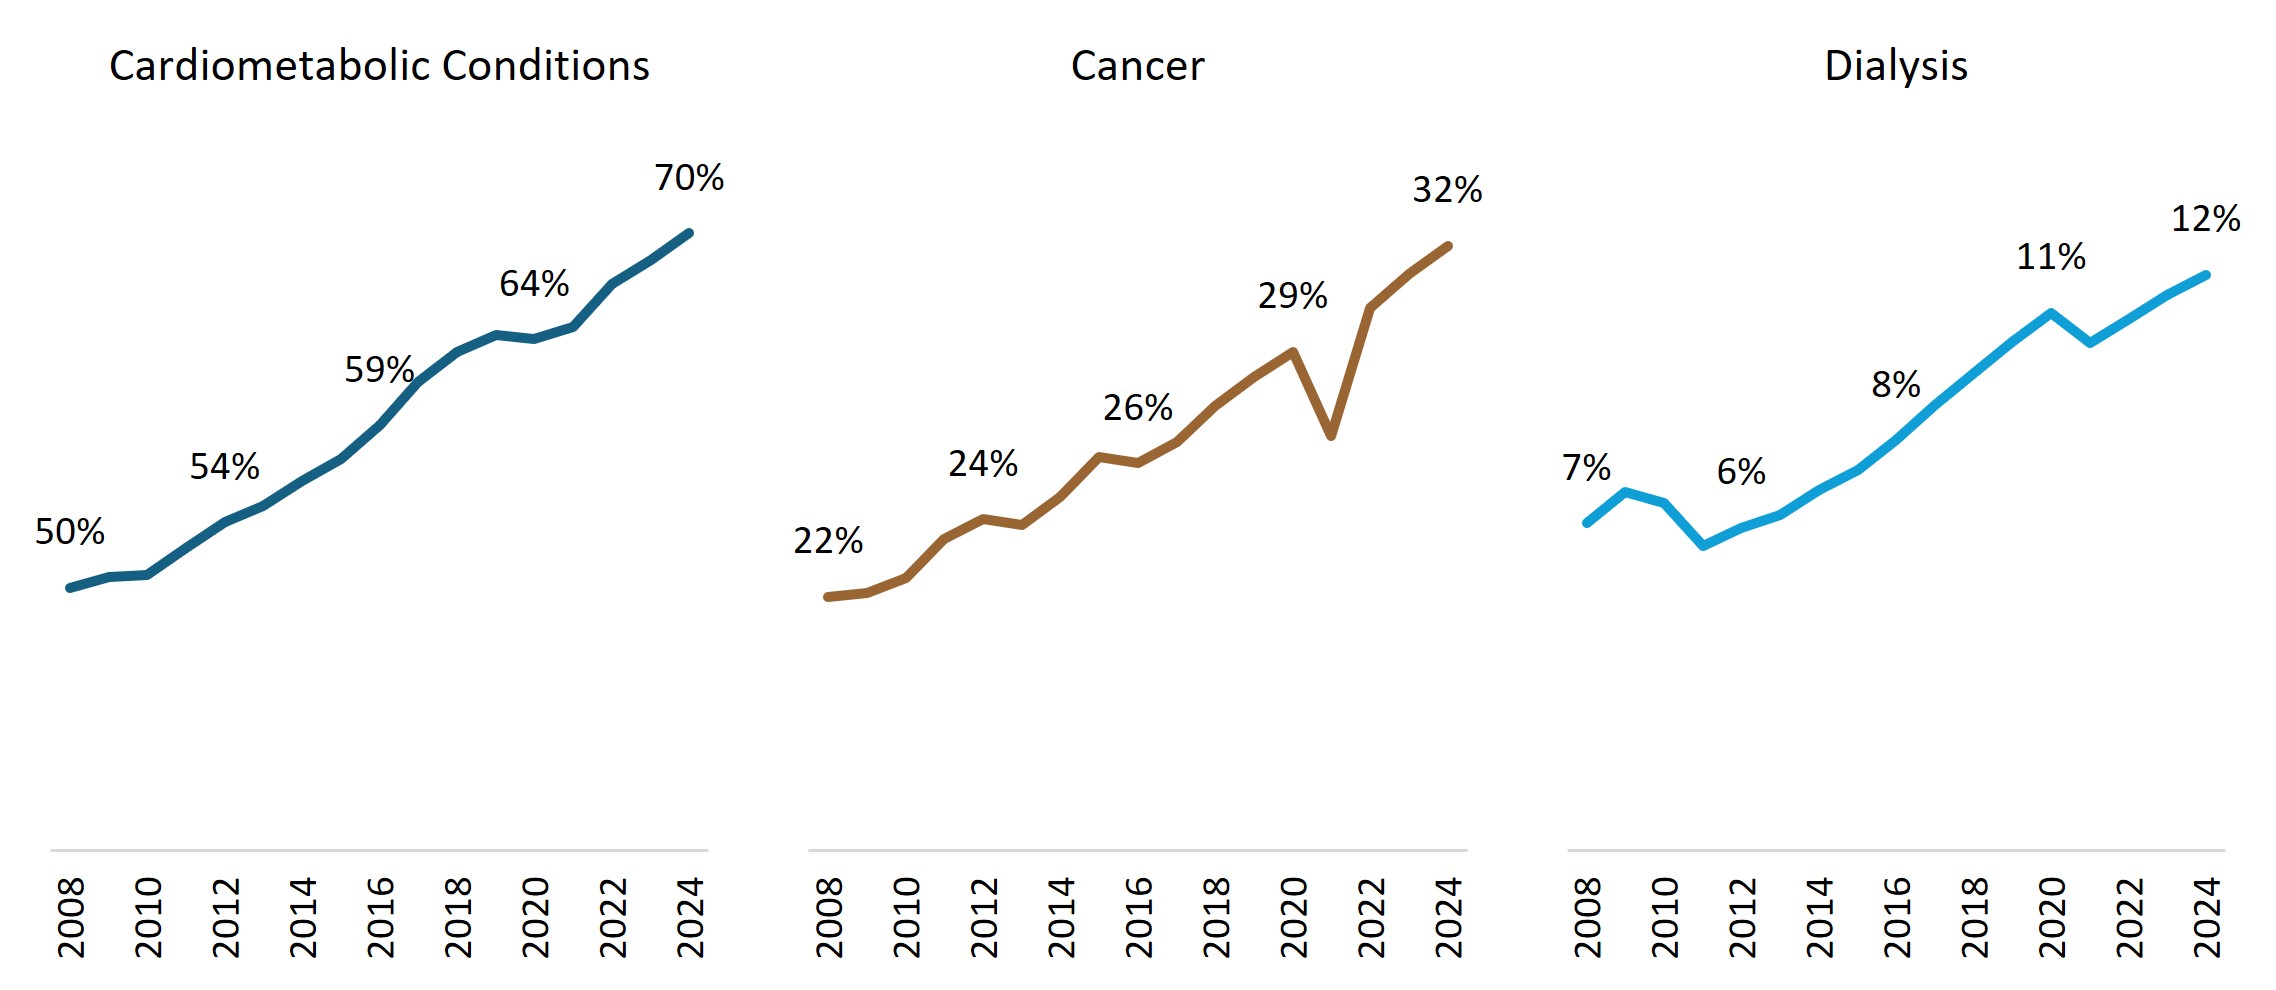
Figure 7: Increasing prevalence of key chronic conditions for Top 1% claimants
The healthcare conditions most observed in the Top 1%
Certain healthcare conditions drive a significant proportion of the costs relating to the Top 1% claimants, specifically cardiovascular episodes (accounting for 19% of costs), cancer (17%), infections (11%), and respiratory conditions (8%) as shown in Figure 8.
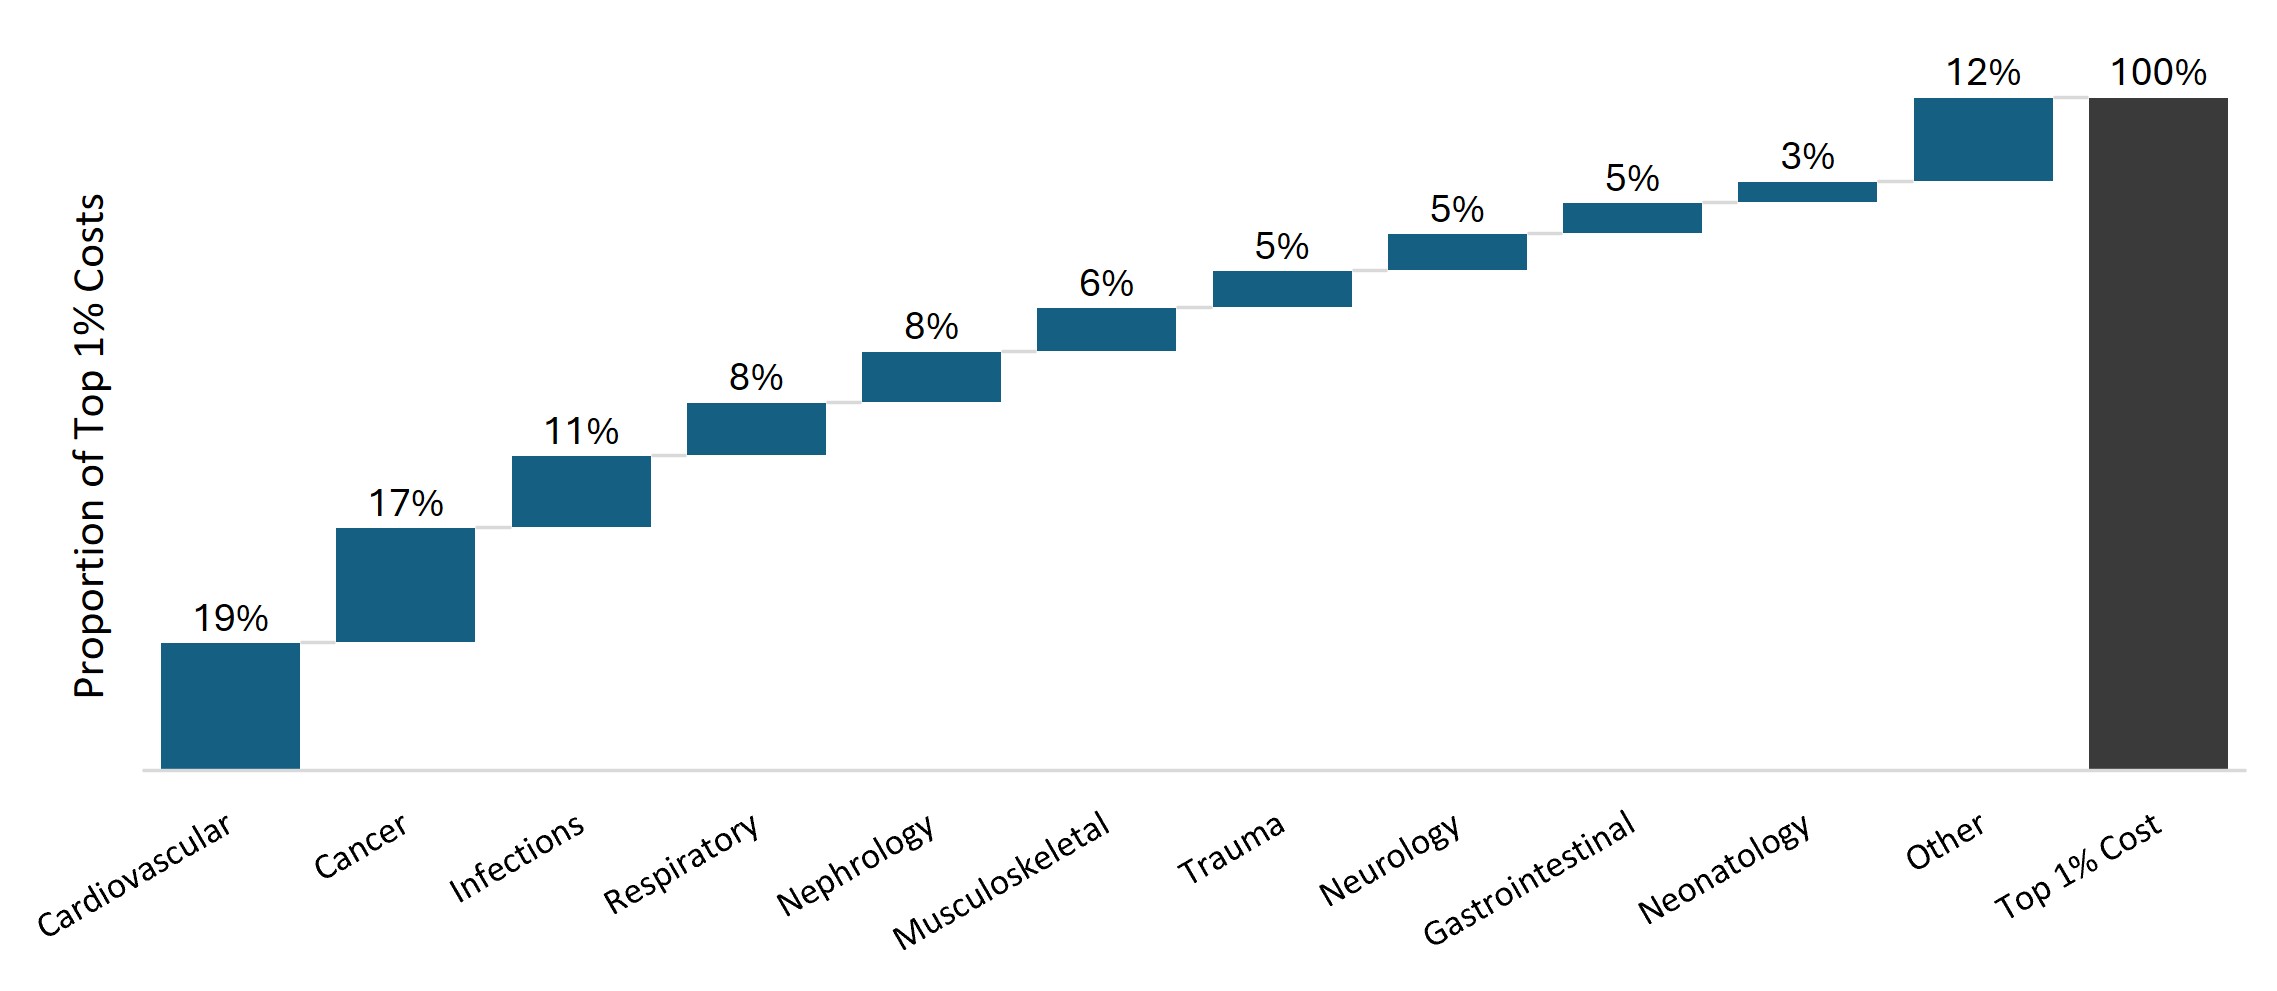
Figure 8: Proportion of costs for Top 1% claimants by disease category in 2024
Spend on these high‑costing members is driven by in‑hospital experience, as 80% of costs for the Top 1% cohort occur in hospital. Figure 9 below illustrates the split between in‑hospital and out‑of‑hospital costs for the common conditions driving Top 1% claims. Most of the costs for these conditions are incurred in hospital, except for costs relating to cancer and nephrology. The significant out‑of‑hospital costs for cancer are due to the high cost of medications and chemotherapy, and the out‑of‑hospital costs for nephrology are for dialysis treatment.
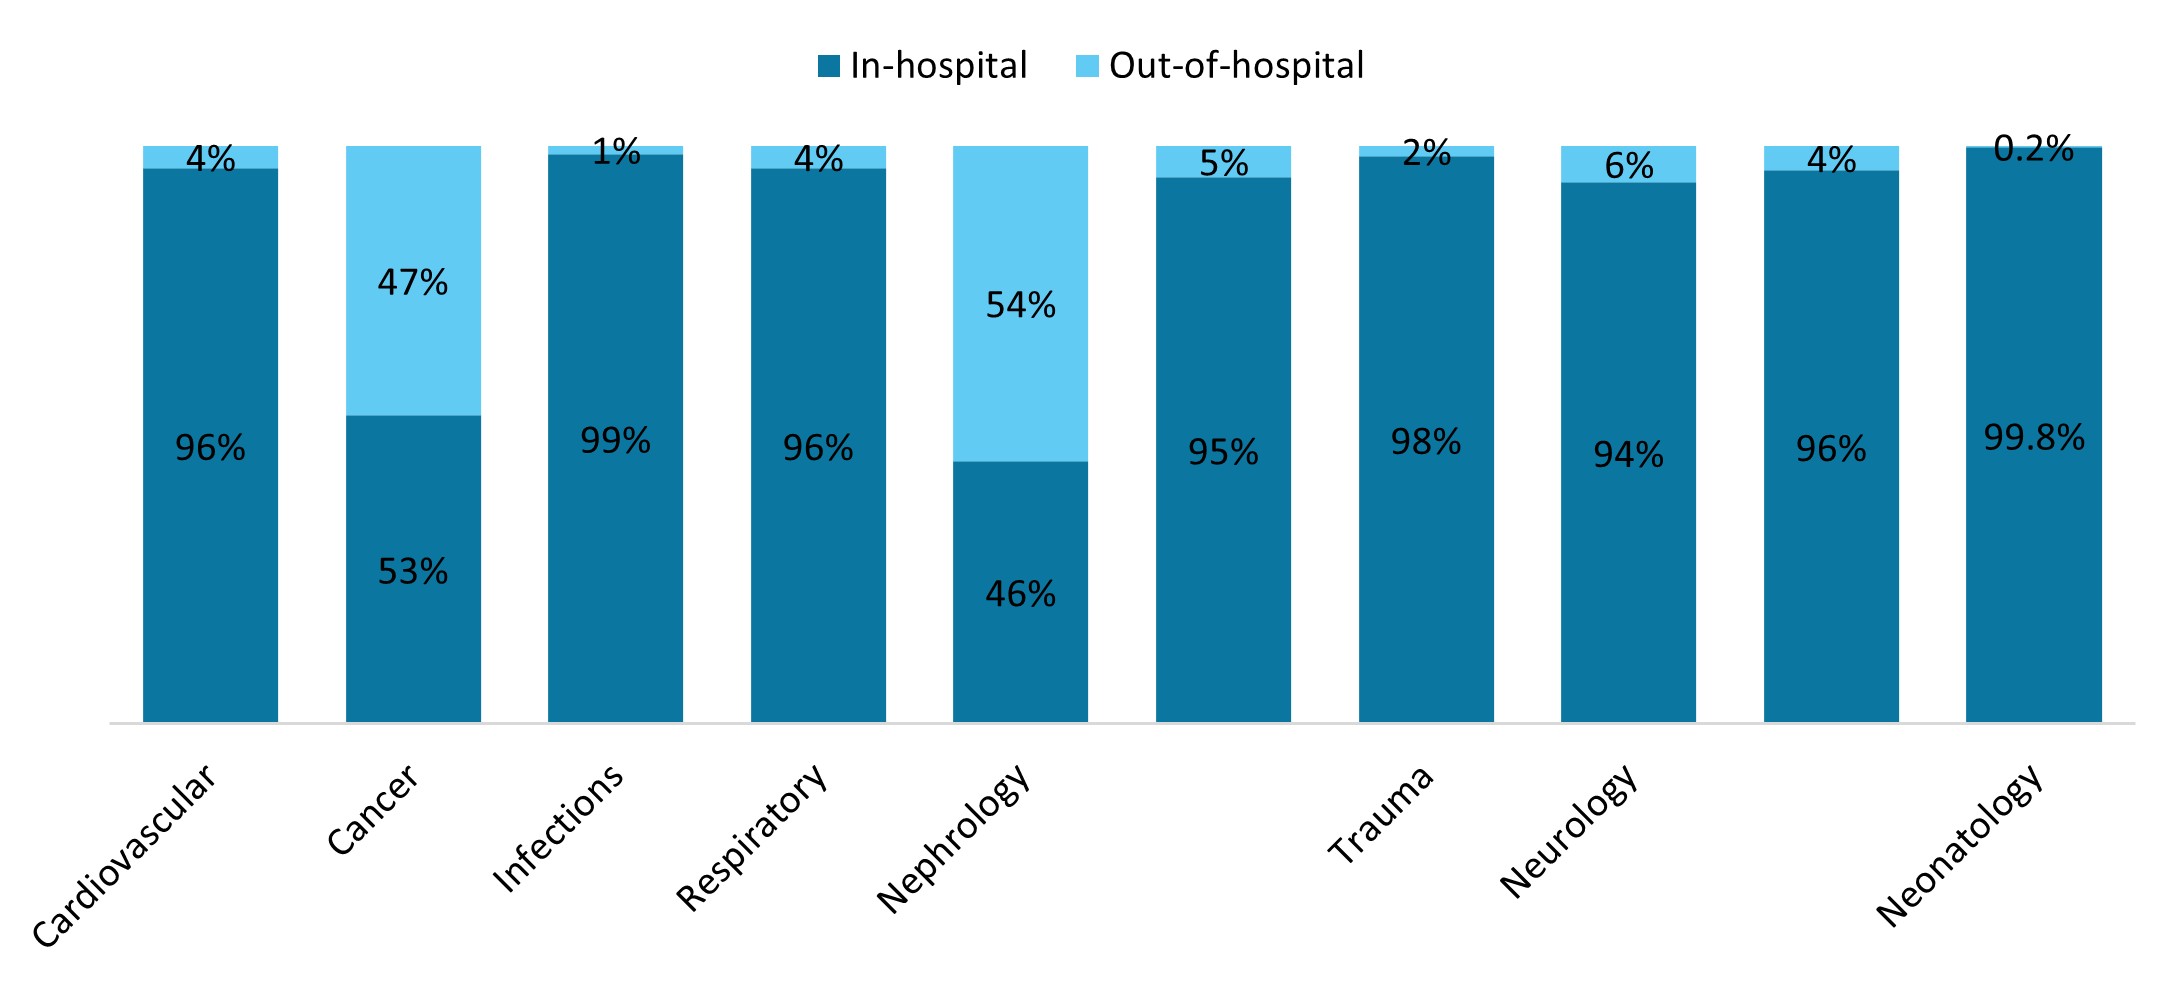
Figure 9: In-hospital and out-of-hospital split of Top 1% costs per disease category
Hospital admissions can be very high costing. Figure 10 below indicates examples of high‑costing diagnosis related groups (DRGs), and the proportion of admissions for these DRGs which relate to Top 1% claimants.
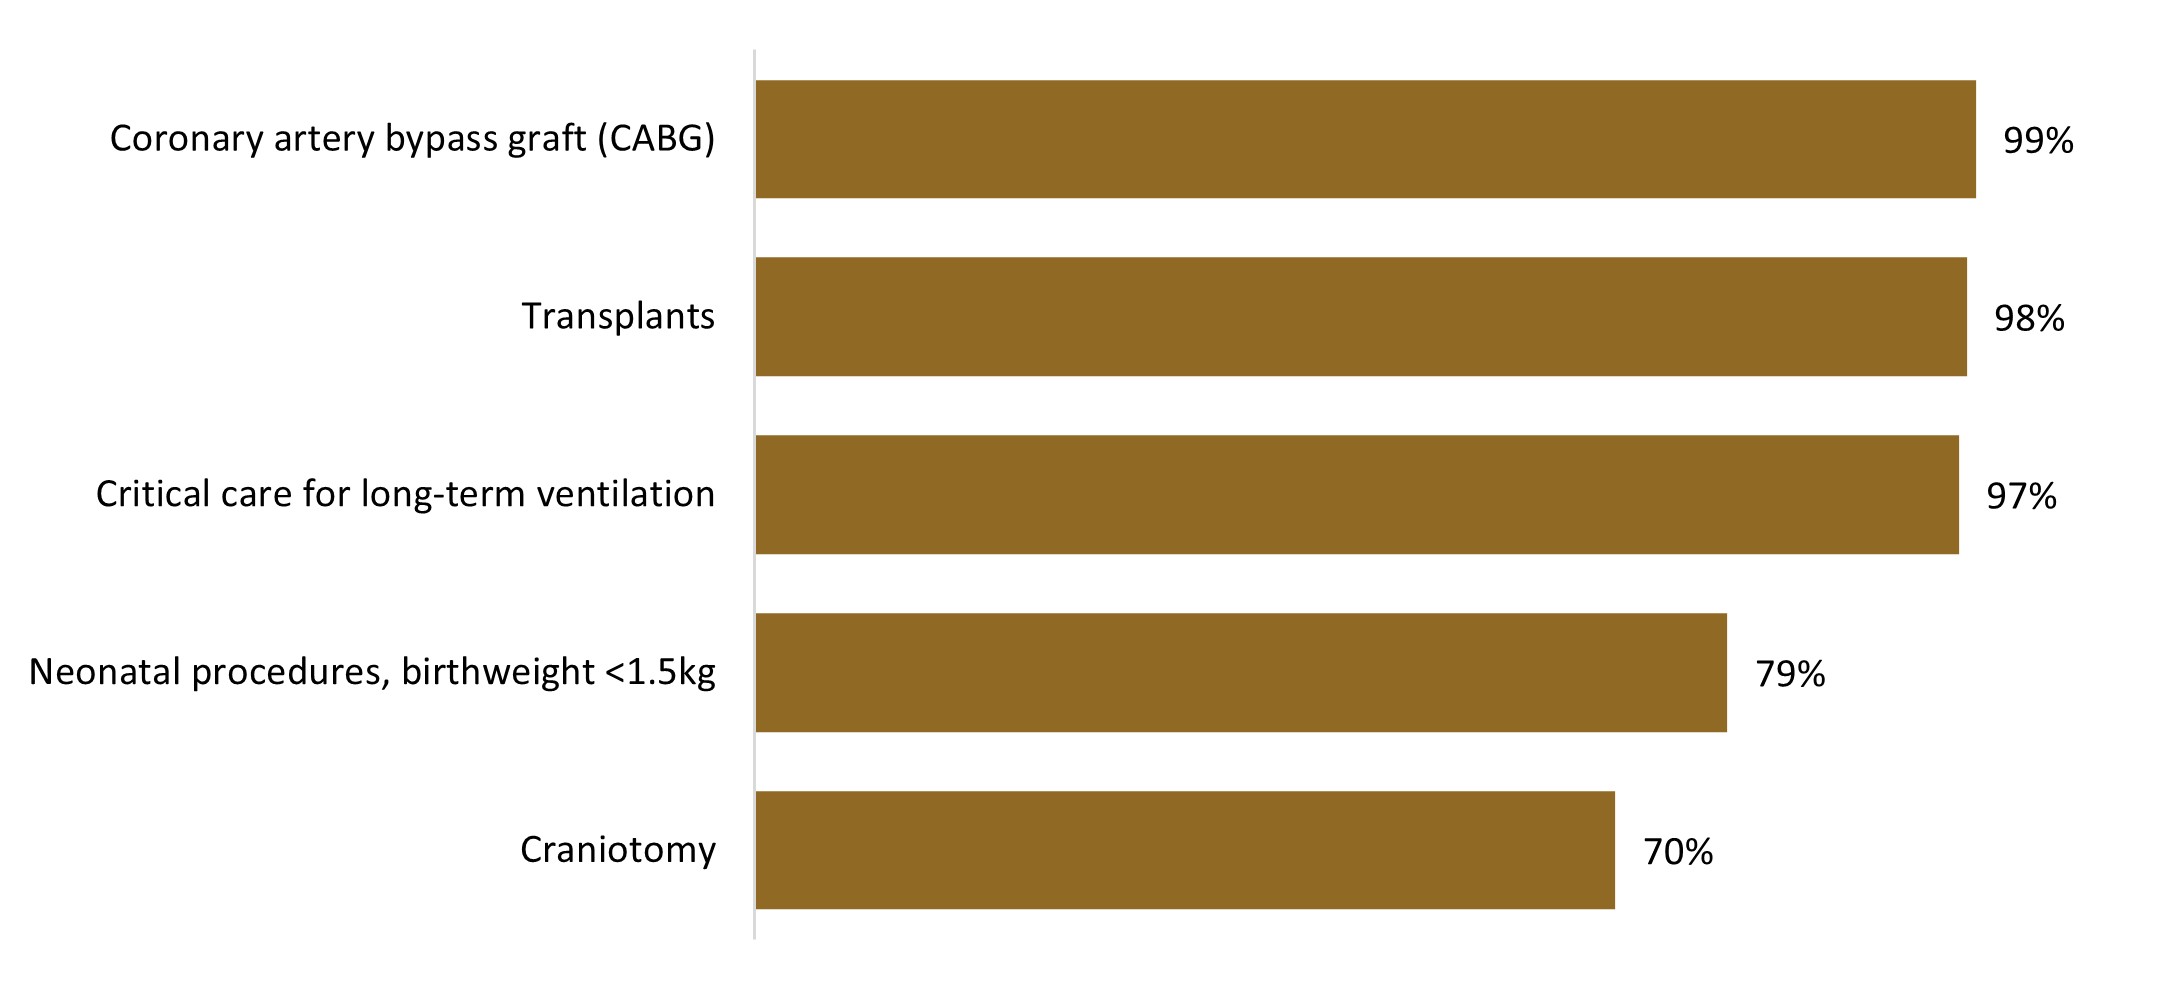
Figure 10: Proportion of admissions relating to the Top 1% cohort for various high-costing DRGs
Critical care for long‑term ventilation may be for members with complex medical conditions, or relatively healthy members who have suffered a trauma incident. For example, a 30‑year‑old member, who was not in the Top 1% cohort in 2023, suffered a head injury and was in the Top 1% cohort in 2024, costing the Scheme over R2 million in 2024.
The conditions driving costs for the Top 1% claimants differ by the age of the claimants. Figure 11 highlights these differences for the various age groups.
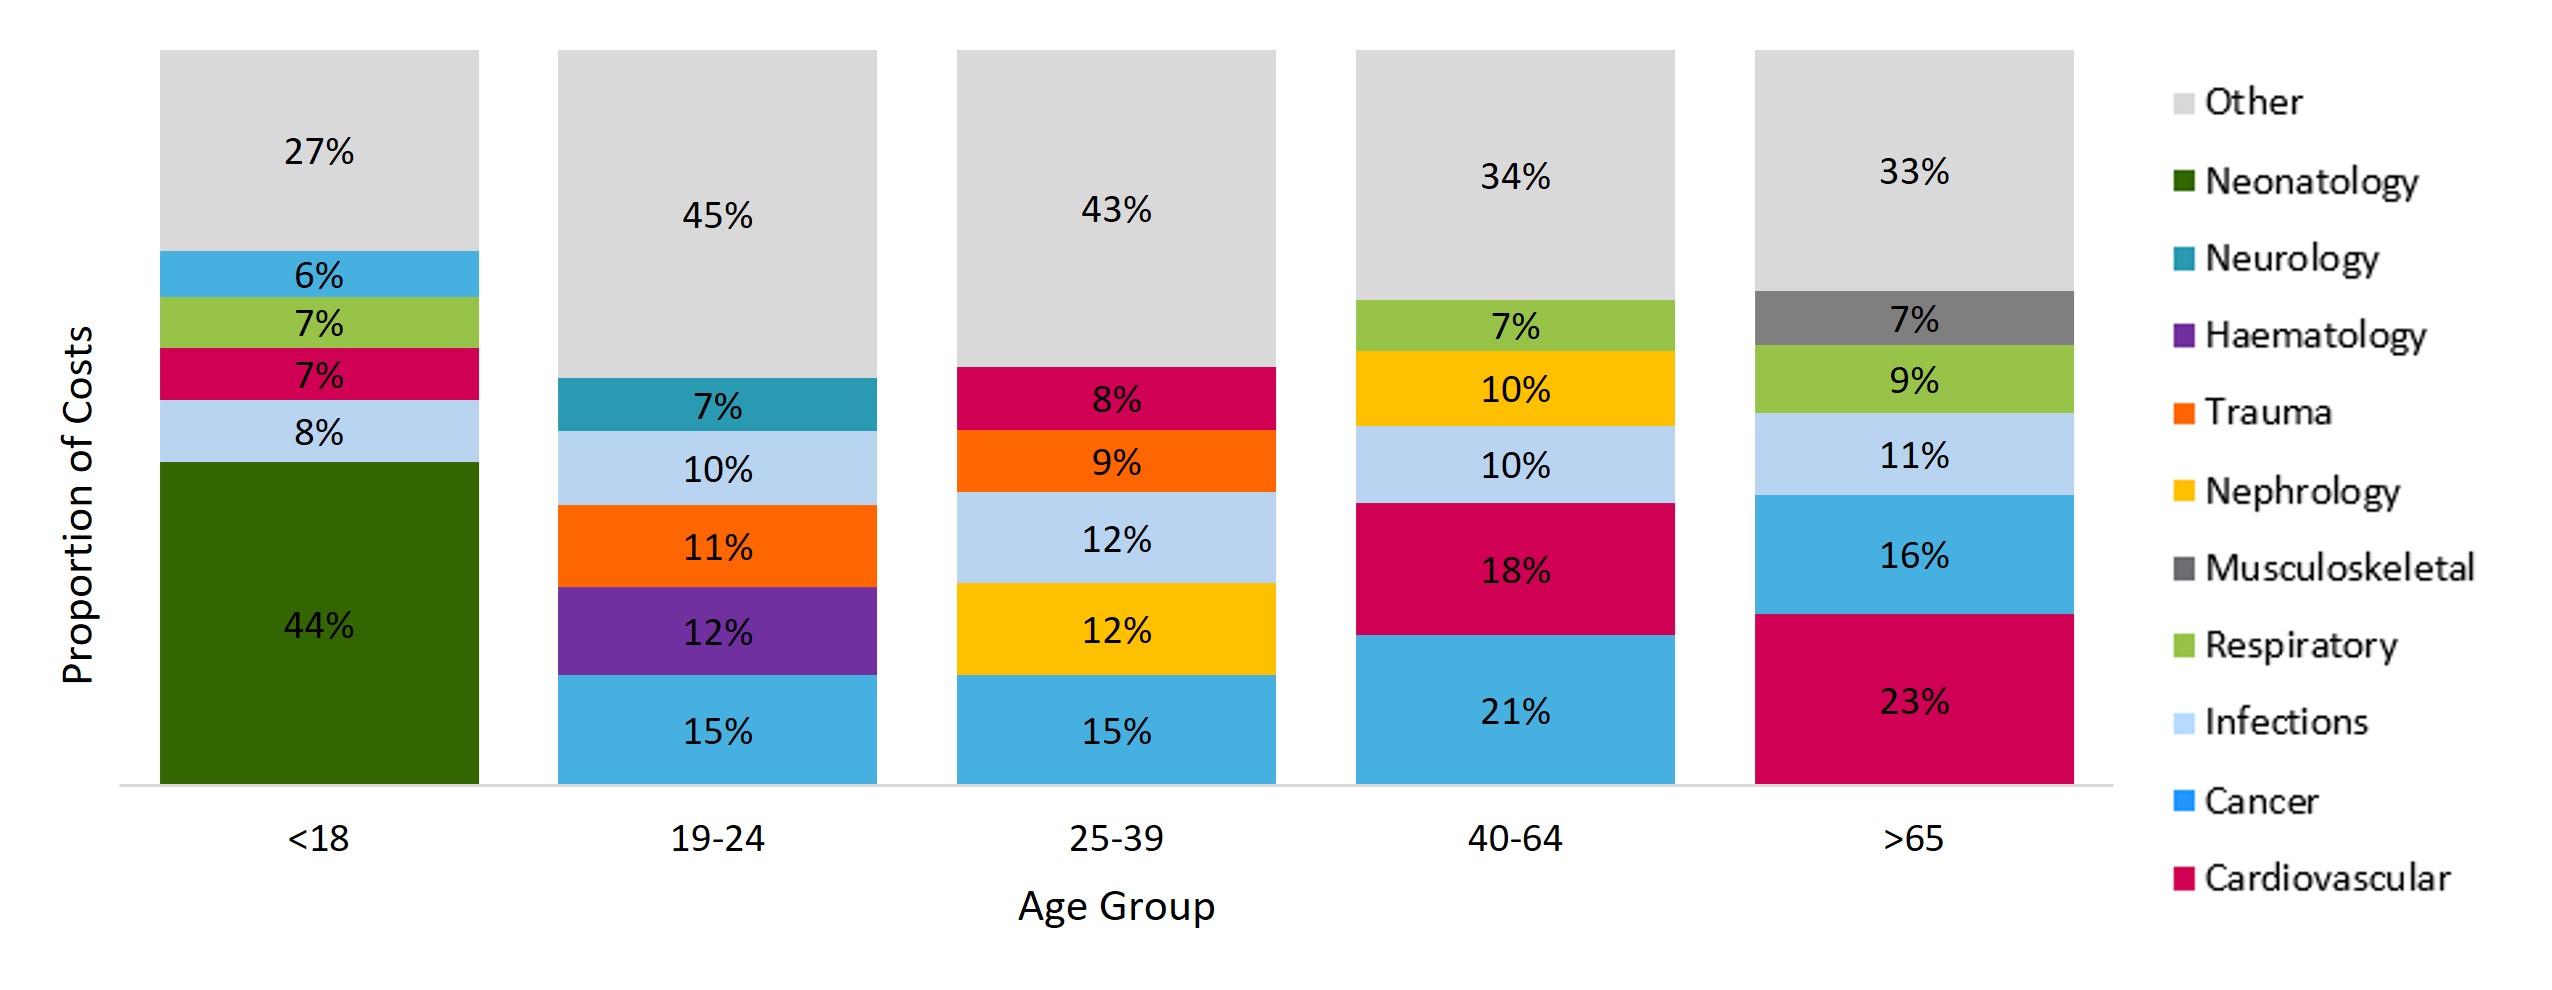
Figure 11: Proportion of costs for each age group within the Top 1% cohort, by highest-costing disease categories
- Top 1% claimants under 18 are predominantly neonates and infants under one year of age, or children with rare genetic disorders, diseases, or cancer. 44% of costs for this age cohort are driven by neonatal treatment.
- For young adults, 12% of costs for these Top 1% claimants (aged 19 to 24) are for trauma admissions. On average, younger members tend to be healthier, with less demand for healthcare services. However, the costs of these unexpected incidents for young lives can be as costly as those for older members, highlighting the value of medical cover for younger members.
- Costs for the older age groups tend towards non‑communicable diseases, such as cardiovascular and respiratory conditions. Common cardiovascular conditions such as hypertension, ischaemic heart disease and hypercholesterolemia are highly prevalent amongst our Top 1% claimants, with 65% of the cohort registered for at least one cardiovascular condition.
Persistent Top 1% claimers
Some members are repeatedly in the Top 1% year on year, driven by ongoing, intensive healthcare needs. Almost one quarter (24%) of the Top 1% cohort in 2024 were also in the Top 1% cohort in 2023, as shown by Figure 12 below. These members are expected to be high costing, and many may be in the Top 1% cohort the following year.
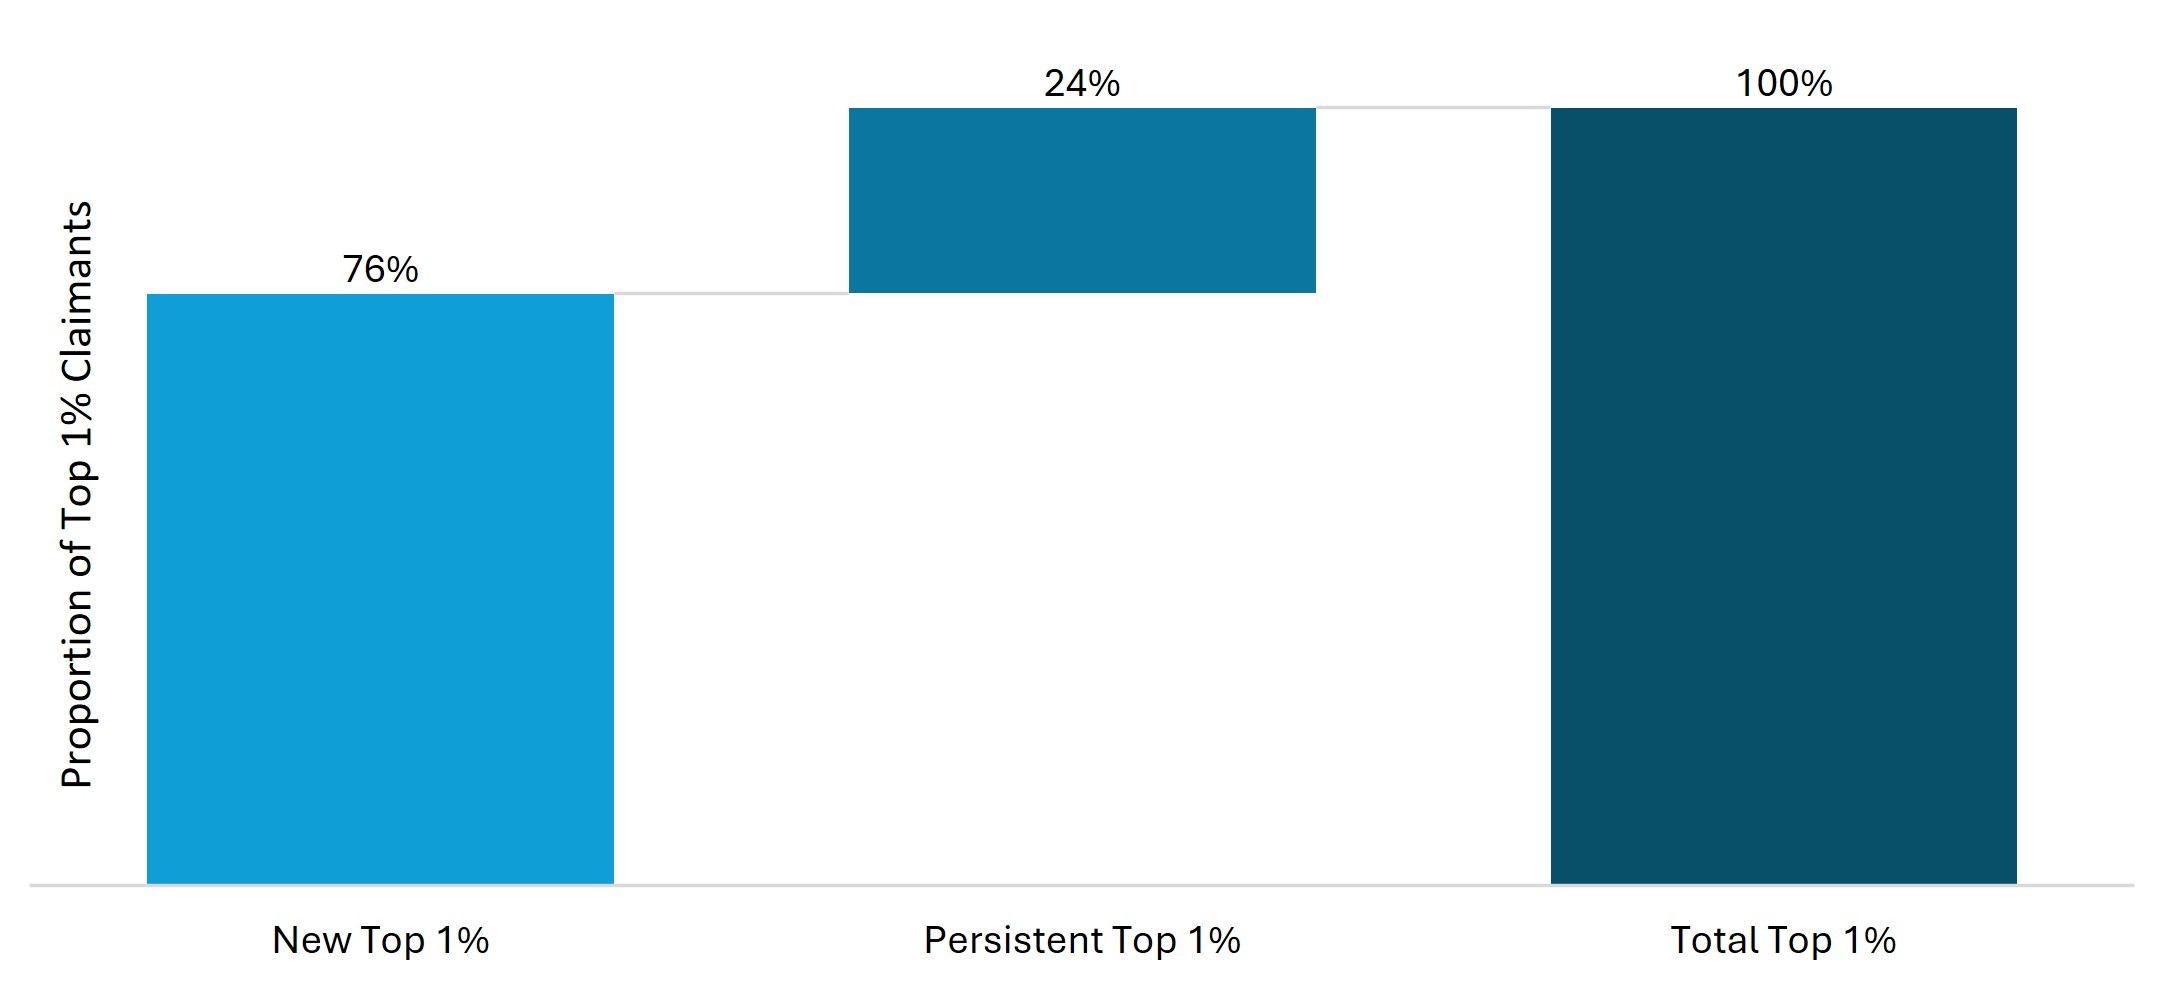
Figure 12: Distribution of Top 1% claimants in 2024 based on whether they were in the Top 1% in 2023
Costs for members entering the Top 1% for the first time are predominantly incurred in hospital, as shown in Figure 13 below. In contrast, a significant proportion of costs for persistent Top 1% claimants (43%) are incurred out of hospital. These differences illustrate that persistent high claimers often require complex, long‑term treatments such as dialysis or cancer care.
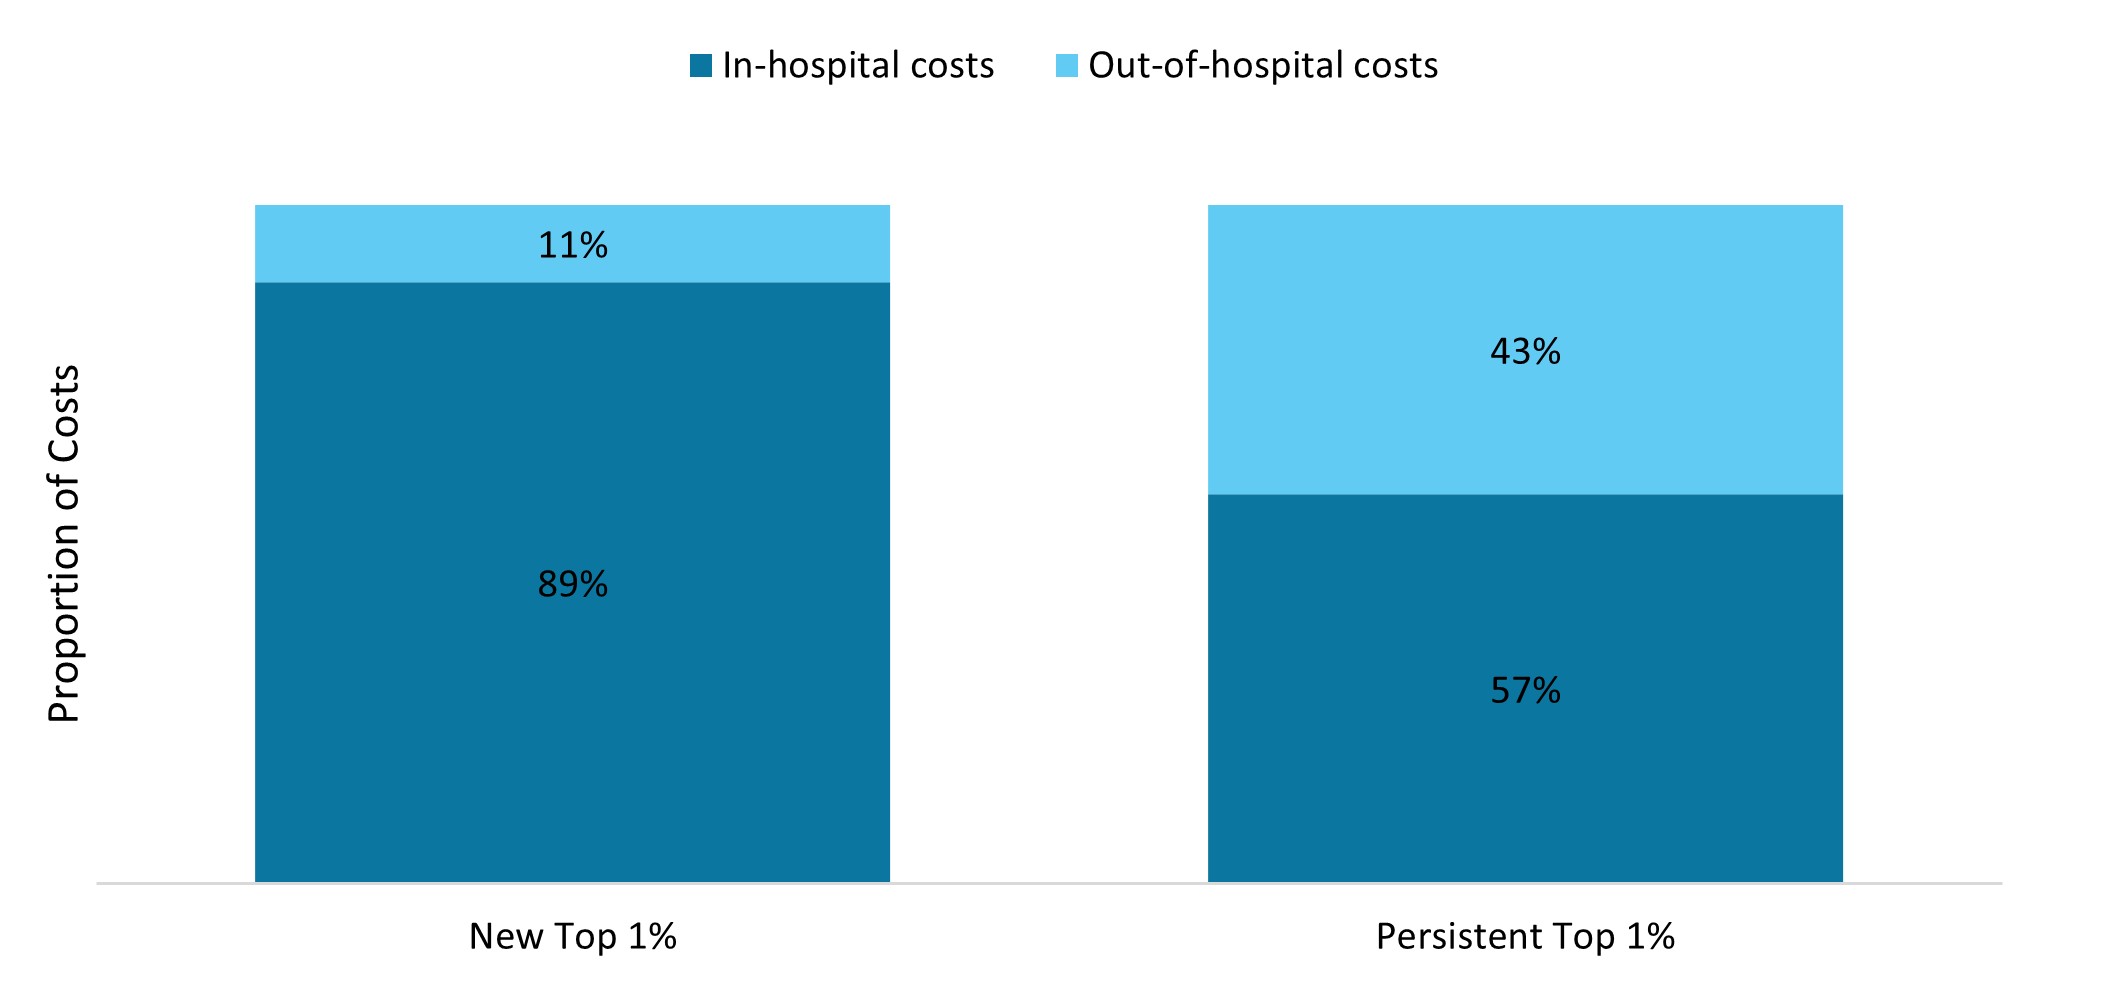
Figure 13: Distribution of in-hospital and out-of-hospital costs for new and persistent Top 1% claimants
Healthcare costs often peak in the final year of life, which is confirmed by our data on the Top 1% cohort. Because of their complex healthcare needs, Top 1% claimants experienced a mortality rate 28 times higher than the Scheme average in 2024, as indicated in Figure 14 below. Furthermore, the mortality rate of persistent Top 1% claimants is higher than that of new entrants into the Top 1% cohort, which may be attributed to the rise in costs in the months preceding a member's passing. As many as 20% of Top 1% claimants from 2024 have since passed away.
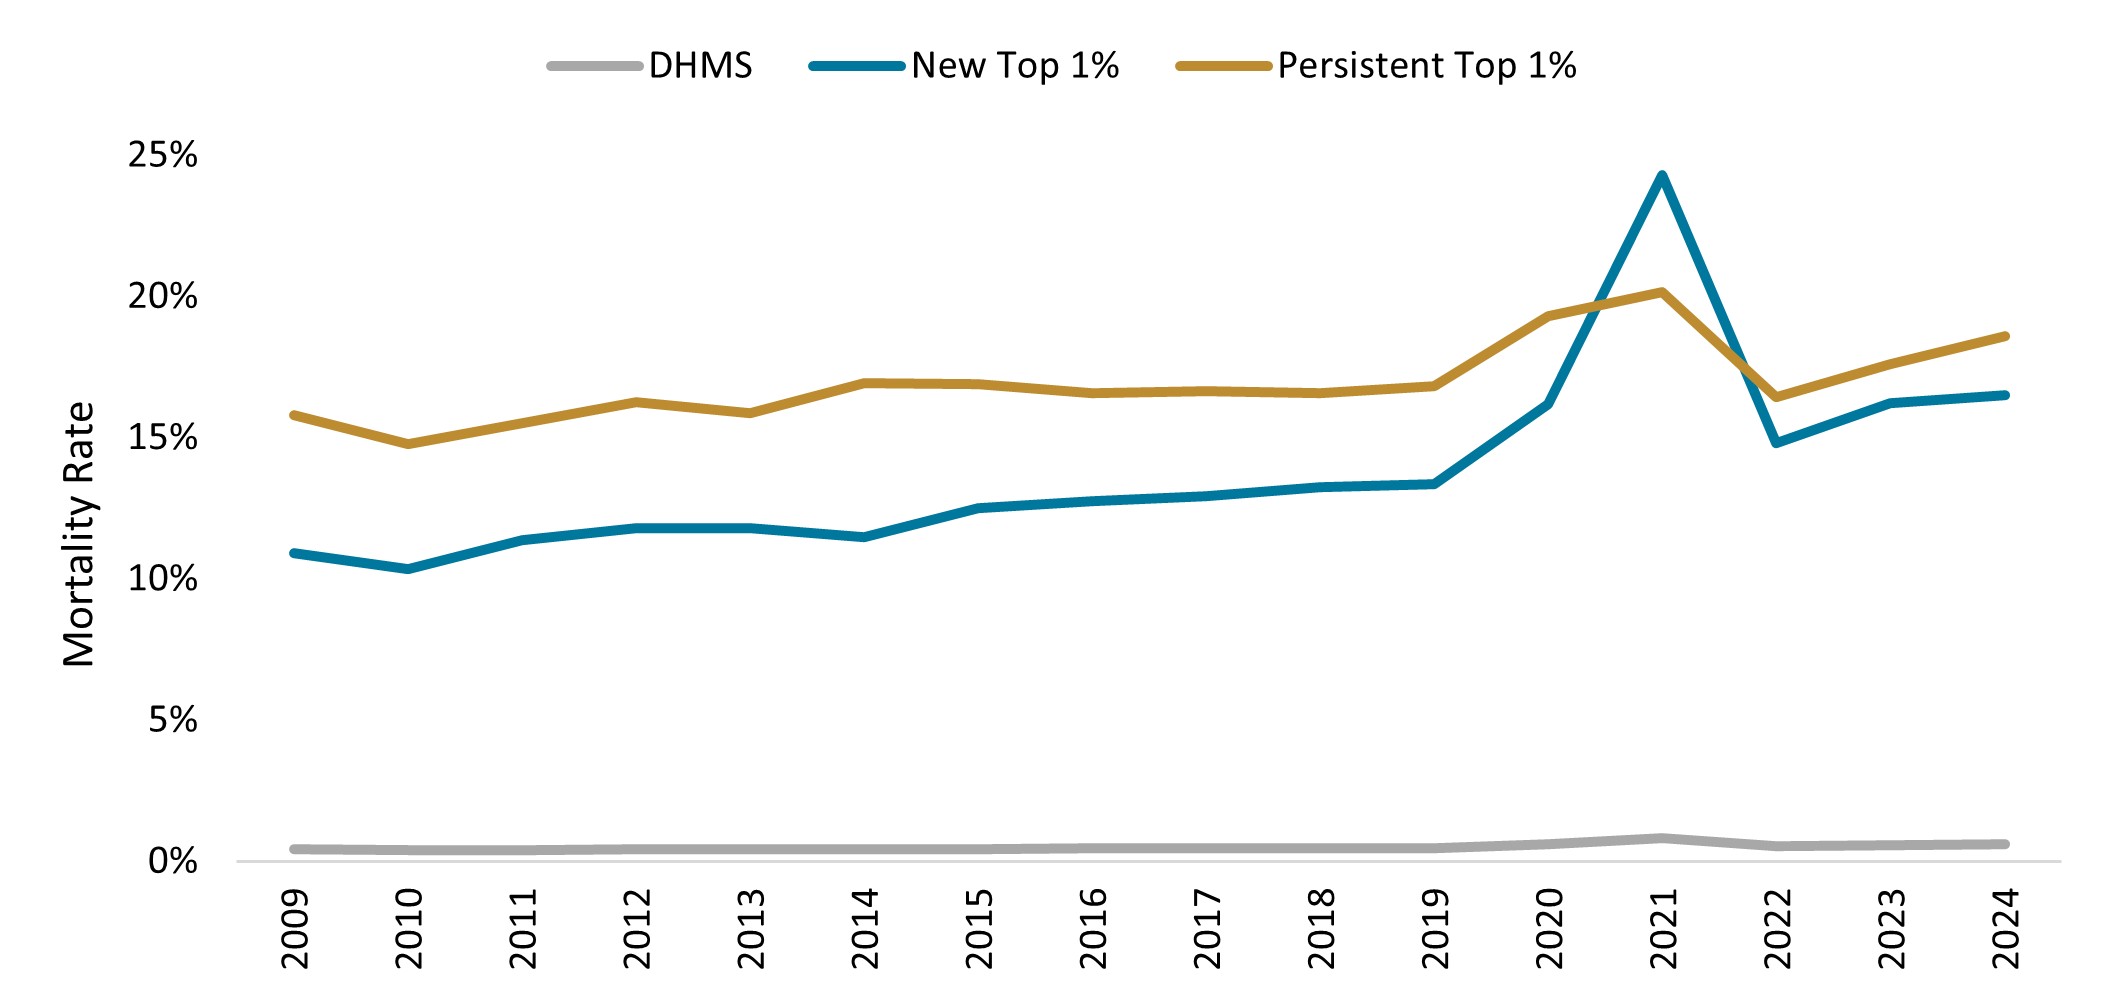
Figure 14: Mortality rate for new and persistent Top 1% claimants compared with the DHMS average from 2009 to 2024
How has the Top 1% cohort changed over time?
Top 1% claimants represent a cohort of intense healthcare utilisation in 2024, highlighting the Pareto Principle across various metrics. While the proportion of costs relating to Top 1% claimants has remained consistent over time, clear shifts in the underlying population are observed:
- Aging: The average age of a Top 1% claimant has increased by seven years since 2008, whereas the average age of the Scheme membership increased by five years over the same period.
- Chronicity: Top 1% claimants have become sicker over time, with an increasing proportion of multimorbid members in the Top 1% cohort since 2008. The prevalence of cardiometabolic conditions, cancer and dialysis treatment has also increased significantly since 2008.
- Utilisation: The cost per Top 1% claimant has increased at a rate of 22% more than the cost per claimant outside the Top 1% on average since 2008.
- In-hospital experience: The conditions driving costs for the Top 1% cohort have remained consistent over time, namely cardiovascular, cancer and respiratory conditions. However, an increasing proportion of Top 1% spend is occurring in-hospital settings, with 81% of Top 1% healthcare costs relating to in-hospital treatment in 2024, compared with only 77% in 2008.
- Out-of-hospital experience: Out-of-hospital visits to healthcare practitioners have increased amongst Top 1% claimants. Furthermore, there has been an increase in the prevalence of cancer and members needing dialysis treatment within the Top 1% cohort, with these Top 1% claimants accounting for 62% of chemotherapy costs and 83% of dialysis treatment costs in 2024.
Conclusion
The Pareto Principle is evident in DHMS, where a small proportion of members (1%) drive a significant share of claims costs (33% of spend). These members are typically older, medically complex and require intensive healthcare, particularly in hospital settings. Cardiovascular conditions and cancer are the top cost drivers, however, trauma incidents also contribute significantly to costs, particularly for younger members. This Pareto Principle is expected in medical schemes given the open enrolment and community‑rated structure which relies extensively on risk cross‑subsidisation.
This Top 1% cohort consumes a significant share of healthcare resources. By understanding this complex and costly group of members, there is an opportunity to improve the quality of life and healthcare outcomes of Top 1% claimants and ensure that the funding and cross‑subsidies for these healthcare needs remain sustainable.
Interested in knowing more or reporting on these findings?
Please contact us on MEDIA_RELATIONS_TEAM@discovery.co.za to request any updated data available since publication and to obtain any further context required.
Did you find this post interesting?
Please visit our Discovery Health Insights Hub for a range of analyses and insights shared by our Discovery Health Intelligence Team over the past three and a half years and spanning a variety of health related themes.
All information shared on this page is based on perspectives gained from analysing data acquired by Discovery Ltd and its various affiliate entities (Discovery). The analysis, which is conducted by Discovery's actuarial and data science team, aims to encourage industry dialogue. Publications containing our analyses are shared for educational and informational purposes only. Each publication reflects only the data available for analysis at the time of publication. It does not, unless otherwise indicated, constitute peer reviewed, published scientific research, and hence should not be interpreted as such or used as a basis for altering treatment decisions. While every effort has been made to ensure the accuracy of the content conveyed, we cannot be held liable or responsible for any actions or decisions taken based on the information shared in this article.