Post-COVID series (3 of 3): What's the risk of getting a chronic illness after recovery from COVID-19?

Some people who recover from COVID-19 experience persistent, related symptoms and complications. In this - the third of three articles in our post-COVID series - we share our preliminary analysis of Discovery Health administered medical schemes members' long-term chronic illness registration outcomes after recovery from COVID-19.
Author names: Shirley Collie (Chief Healthcare Analytics Actuary, Discovery Health), Lebohang Radebe (Data Scientist, Discovery Health), Tommy Chen (Actuary, Discovery Health), Jared Champion (Senior Actuary at Discovery Health), Donald Ntjana (Senior Data Scientist at Discovery Health), Dr Dave Jacobs (Senior Clinician and Clinical Classification System Architect at Discovery Health), Dr Smybinn Mathews (Clinical Risk Specialist at Discovery Health), Sameera Haneef (Senior Actuary at Discovery Health), Lizelle Steenkamp (Senior Healthcare Statistician at Discovery Health) and Matt Zylstra (Senior Actuary, Risk Intelligence at Discovery Health)
A three part analysis and article series
This is the third of three articles assessing Discovery Health administered medical schemes members' long-term experience, after recovering from COVID-19. Here, we cover chronic condition trends, measuring new chronic registrations (in other words being diagnosed with and registering for a chronic illness care benefit through the member's medical scheme) post COVID-19 recovery.
Numerous reports point to the onset of new chronic conditions post COVID-19 recovery. They also show a worsening of existing conditions - in particular diabetes and hypertension.
In this article we analyse chronic condition trends to find out whether, among administered medical scheme members:
- Certain condition outcomes are worse in after recovery from COVID-19.
- Whether the overall incidence of chronic conditions increases after recovery from COVID-19.
The other two articles in this series provide feedback on admission and mortality rates after recovery from COVID-19.
Background to our analysis
By 31 May 2022, 18.5% (609,890 members) of Discovery Health administered medical scheme members had experienced a documented COVID-19 infection.
The immediate clinical and financial impact of acute COVID-19 has been well-described in numerous global publications [1,2]. What the local and global scientific community is still documenting is the detail around long-term healthcare utilisation patterns and mortality impact in people who recover from COVID-19. In other words, once people get and recover from COVID-19, how likely are they to experience other health-related events in the future that are related to their having got COVID-19?
- It is important to note that our findings very likely offer a conservative perspective given the likelihood of a high number of undocumented COVID-19 infections in the control, reference population.
Our methodology
For the purposes of this analysis, we considered Discovery Health administered medical scheme member data for the period 1 March 2020 - 30 November 2021.
- 404,067 members were included in the analysis (these individuals had a documented COVID-19 infection determined by a positive PCR test or a healthcare provider's diagnosis).
1) Establishing a test and a control group
We applied a bootstrapping technique to this study cohort in order gain insight into the statistical significance of our findings. Specifically, we randomly selected 404,067 individuals with replacement 500 times to create bootstrap samples of members with an equivalent size to our study cohort size. For each individual who had COVID-19 (test group member), we randomly selected a maximum of 100 potential comparators (clinical comparator) who'd had no documented COVID-19 infection but who had the same underlying health risk factors at two and three months prior to the test group member's COVID-19 infection. We then randomly matched each infected individual to a clinical comparator within each bootstrap without replacement (i.e., there was no duplication of control comparators within a bootstrap).
We refer to these pairs of matched infected and uninfected individuals as clinical twins.
2) Why did we look at the period two and three months prior to documented infection date in carrying out our matching?
We went back three months prior to infection for matching, as in the first month prior to the documented infection date, we noted increased healthcare utilisation for the COVID-19 infected individual. Given that the date of documented infection may be several days after the actual clinical infection date, this utilisation was likely attributable to infection, and we wanted to match on patient characteristics independent of utilisation attributable to the acute infection phase. We then specifically selected two time periods - two and three months prior to documented infection date - to ensure that the trend of healthcare utilization patterns in the period prior to infection was consistent between the study population and their matched clinical twins.
This method enabled us to construct a statistical confidence interval around our uninfected population which incorporated both the variability in the demographics of the underlying population being evaluated and the consequent variability of outcomes.
3) The underlying health risk factors we matched on included:
- Age: <1; 1-4; 5-11; 12-18; 19-64 (clinical twins were matched within one year of age of each other); 65+
- Member's sex: Male (M) or Female (F)
- Location: Province in South Africa
- Number of chronic conditions: 0, 1, 2 or more
- Number of prior flu vaccinations: 0, 1, 2 or more. People who had a flu vaccination in the years leading up to and during the COVID-19 pandemic were likely to adhere to preventive health measures and make choices that promote their general health and wellbeing.
- One of five medical scheme product options: Looking at out-of-hospital benefits we divided the 24 plans available through 19 schemes (Discovery Health Medical Scheme and 18 other Discovery Health administered medical schemes), into 5 groups.
- Vaccination status: Having had 'at least one dose' of any COVID-19 vaccine prior to a member's first COVID-19 infection; or 'unvaccinated'
- Diabetes status: Registered on a Chronic Care Benefit (CCB) for this disease; or not registered.
- Hypertension status: Registered on a CCB for this disease; or not registered.
- Ischaemic heart disease status: Registered on a CCB for this disease; or not registered.
- Number of in-hospital admissions in the two and three months prior to COVID-19 infection.
- Probability of an in-hospital admission within the next six months (matched within 2.5% of each other). To work out the probability of an in-hospital admission we used a separate predictive model, which took the following factors into account:
- Chronic conditions a member was registered for
- Demographic factors such as age, sex and type of medical scheme plan the member was on
- The sort of doctors the member had seen in the past 12 months
- Medicines that a member had claimed for in the past 12 months
- Procedures and consultations a member had claimed for in the past 12 months
- ICD10 information from claims submitted in the past 12 months
We compared clinical twins' experiences from the three months before the test group member got COVID-19 and for up to 12 months after the test group member recovered.
- The test group member's recovery date from COVID-19 was based on either 14-days post a test group member's positive PCR collection date or, where they were admitted to hospital, their discharge date.
4) Matched clinical twin pairs were removed from the analysis from the point of time in the follow up period when:
- Either person withdrew their membership of a Discovery Health administered medical scheme
- Either person died
- The person who got COVID-19 was vaccinated after their infection, or the matched clinical twin was vaccinated (so as not to confound the effects on clinical outcomes).
- The matched clinical twin had a documented COVID-19 infection
- The person who got COVID-19 (test group) had a second documented COVID-19 infection.
5) Chronic registrations were assessed over two periods - in the COVID-19 acute phase (when a person had COVID-19) and recovery phase (the 12 months that followed). What did we measure?
Given that the actual number of chronic registrations vary by member demographics (i.e., by sex, age, number of chronic conditions, and so on), we standardised our analysis by examining the number of registrations per "1,000 life months". This measure looks at the number of registrations per 1,000 members, per month and allows us to compare our results across the different sub-cohorts. Given that the duration of period zero is not standardized at a month (the time frame ranges from a minimum of two weeks for non-admitted patients, to a maximum of two weeks after discharge for admitted patients), we refer to the number of chronic registrations per 1,000 infections during the acute period of infection (period 0).
We looked at:
Chronic registration risk: How much higher is the risk of registering for a chronic condition once people have had and recovered from COVID-19, compared to a matched clinical twin (who didn't get COVD-19)? We worked this out as:

A result, or ratio >1 means that in the months after people get and recover from COVID-19, there's a higher chronic registration rate in the COVID-19 study population relative to the non-COVID19 population. Where the relative risk ratio is <1, the opposite is true.
We assessed the statistical significance of our findings to confirm that the differences we saw were unlikely to be due to underlying population variability alone.
Definitions:
Number of chronic registrations: The absolute number of chronic registrations in the group that got COVID-19 per 1,000 infections or life months, over a particular period.
Excess chronic registrations: The number of registrations in the COVID-19 population that were over and above the number of registrations in the non-COVID-19 population, per 1,000 infections or life months. The higher the number of excess chronic registrations, the more that people in the COVID-19 population were registering for chronic conditions for the first time in the period of infection and up to twelve months thereafter, than were the general population.
We worked this out as:
Chronic registrations in the COVID-19 test group - Chronic registrations in the comparator group
We assessed the statistical significance of our findings to confirm that the differences we saw were unlikely to be due to underlying population variability alone.
Excess chronic registrations were compared against those of matched clinical twins. If the 95% confidence interval of the difference in outcomes did not cross zero (i.e., no difference observed), we deemed them to have a statistically significant higher outcome rate.
In the time after recovery from COVID-19, the average chronic registration risk, average number of chronic registrations and average excess chronic registrations were weighted by the total exposure (the changing number of matched clinical twins over time) in order to account for the decreasing number of clinical twins under observation over time.
6) What types of chronic registrations did we look at?
Overall, we looked at the presence of a chronic condition (i.e., members with one or more chronic conditions versus no chronic conditions), at diabetes (both type 1 and type 2) and at hypertension.
These registrations were further assessed by looking at:
- Member's sex: Male (M) or Female (F)
- Ages: Brackets looked at were <1, 1-4, 5-11, 12-18, 19-39, 40-49, 50-59, 60-69, 70-79 and 80+
- Likely COVID-19 variant contracted, based on when people got COVID-19 and which wave of infection the country was in at the time. Variant options were D614G (wave 1), Beta (wave 2) or Delta (Wave 3).
- Vaccination status: Unvaccinated or fully vaccinated. Fully vaccinated individuals were those who'd had a COVID-19 infection at least 14 days after dose two of any COVID-19 vaccine. South Africa's first phase of COVID-19 vaccination (17 February to 15 April) focused on healthcare workers. It was on 16 April that vaccination opened up to essential workers and the elderly. Most members of the public only became eligible for and accessed COVID-19 vaccines later in the year, so we have only five months of follow-up data for medical scheme members who were fully vaccinated before their first COVID-19 infection.
- How serious the admission was: Members were assigned to a group according to the most serious phase of their admission. These included Ventilation (considered most serious or 'highest acuity'), Care in ICU, High Care or a General ward or Not hospitalized.
Findings: a) Match quality and number of clinical twin observations over time
Overall, we were able to find potential twin matches for 88.8% (n = 358,887) of our COVID-19 test group cohort. Younger, healthier people had a bigger chance of a potential match. After completing the matching process, our analysis included 80.2% of medical admissions, 77.3% of deaths recorded, and 86.2% of people aged 65 and over (Table 1).
|
|
Total number of clients |
Matched |
Average % of total medical admissions included in our cohort after matching
|
Average % of deaths included our cohort after matching |
Average % of people aged 65 and over, who were matched
|
|
|
Average number of clients across 500 bootstraps |
% of total |
% |
% |
% |
||
|
Overall |
404,067 |
358,887 |
88.8 |
80.2 |
77.3 |
86.2 |
|
Sex |
||||||
|
Female |
216,659 |
223,715 |
88.0 |
80.2 |
78.3 |
88.0 |
|
Male |
185,696 |
190,312 |
88.2 |
80.6 |
76.9 |
84.3 |
|
Number of Chronic Conditions |
||||||
|
None |
255,528 |
243,216 |
95.2 |
94.0 |
92.2 |
|
|
One to Two |
105,700 |
84,456 |
79.9 |
76.7 |
78.1 |
88.4 |
|
Three or More |
43,469 |
29,038 |
66.8 |
66.6 |
69.5 |
82.2 |
|
Age bands |
||||||
|
<1 |
303 |
281 |
92.8 |
89.0 |
|
|
|
1-4 |
4,777 |
4,600 |
96.3 |
94.8 |
58.5 |
|
|
5-11 |
12,570 |
12,249 |
97.5 |
90.7 |
100.0 |
|
|
12-18 |
24,463 |
23,697 |
96.9 |
89.9 |
75.5 |
|
|
19-39 |
157,346 |
142,645 |
90.7 |
84.6 |
79.8 |
|
|
40-49 |
85,972 |
75,353 |
87.7 |
81.3 |
76.6 |
|
|
50-59 |
60,810 |
49,627 |
81.6 |
76.3 |
71.3 |
|
|
60-69 |
32,474 |
25,897 |
79.8 |
75.9 |
73.5 |
|
|
70-79 |
17,186 |
14,782 |
86.0 |
83.4 |
81.8 |
|
|
80+ |
7,552 |
6,482 |
85.8 |
84.2 |
84.1 |
|
|
Circulating COVID-19 Variant |
||||||
|
D614G |
86,825 |
77,648 |
89.4 |
84.2 |
84.8 |
90.0 |
|
Beta |
104,089 |
86,734 |
83.3 |
75.6 |
70.3 |
81.4 |
|
Delta |
214,852 |
193,267 |
90.0 |
82.5 |
80.2 |
87.9 |
|
Vaccination status |
||||||
|
Un-vaccinated |
367,487 |
323,615 |
88.1 |
80.4 |
77.1 |
85.4 |
|
Fully vaccinated |
3,982 |
3,568 |
89.6 |
82.8 |
80.0 |
90.0 |
|
Highest acuity |
||||||
|
Hospitalized: Ventilation |
5,693 |
4,546 |
79.9 |
79.9 |
79.9 |
85.9 |
|
Hospitalized: ICU |
8,729 |
6,852 |
78.5 |
78.7 |
77.0 |
83.3 |
|
Hospitalized: High Care |
9,014 |
7,318 |
81.2 |
81.3 |
78.4 |
85.8 |
|
Hospitalized: General Ward |
46,255 |
37,666 |
81.4 |
80.8 |
75.5 |
83.7 |
|
Not hospitalized |
344,243 |
306,825 |
89.1 |
77.4 |
79.5 |
88.2 |
Table 1. Categories considered in our analysis of Discovery Health administered medical scheme members who had a documented COVID-19 infection and who were matched to a clinical twin (1 March 2020 - 30 November 2021).
An overall 88.8% match rate resulted in a mean of 358,887 [95% CI: 358259, 359516] members per bootstrap in the infection period. Keep in mind that we removed clinical twins from our analysis where there were scheme withdrawals, deaths, new infections, re-infections, or COVID-19 vaccinations in the post-infection or follow up period.
In the follow-up period, we experienced a steady decrease in the number of members under observation - from a high of 305,535 [95% CI: 304870, 306202] members in month one since recovery to 33,512 [95% CI: 33178, 33846] members at 12 months post recovery (Figure 1).
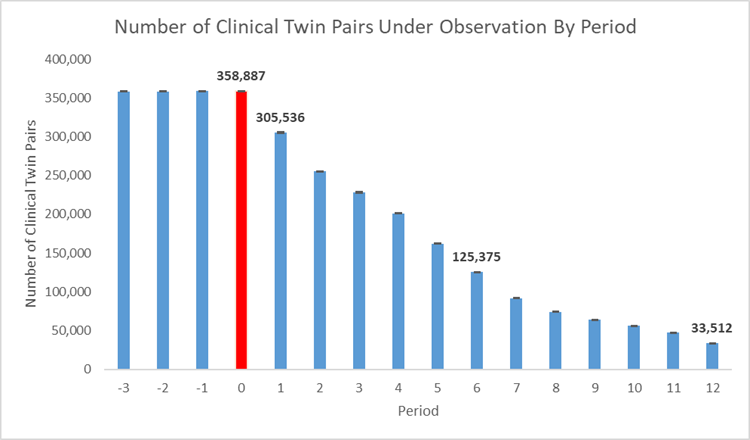
Figure 1. Number of clinical twins under observation over time where red (period 0) shows the acute infection period.
a) Overall Chronic registration rate
In the period prior to infection (two to three months prior), there is no observed statistical difference between our infected and uninfected populations, indicating a good clinical match.
During the period of infection (period 0), the chronic registration rate for infected individuals increases significantly. And in the recovery phase (2 to 12 months post infection), the rate decreases but remains above matched, uninfected individuals (see Figure 2 a).
Specifically, we see (Figure 2a):
- 321.0 chronic registrations per 1,000 infections during the period of infection (y-axis)
- A 1.03 times higher chronic condition risk one month post recovery
- A 1.03 times higher weighted average chronic registration risk compared to matched clinical twins with no infection until month 12 post recovery
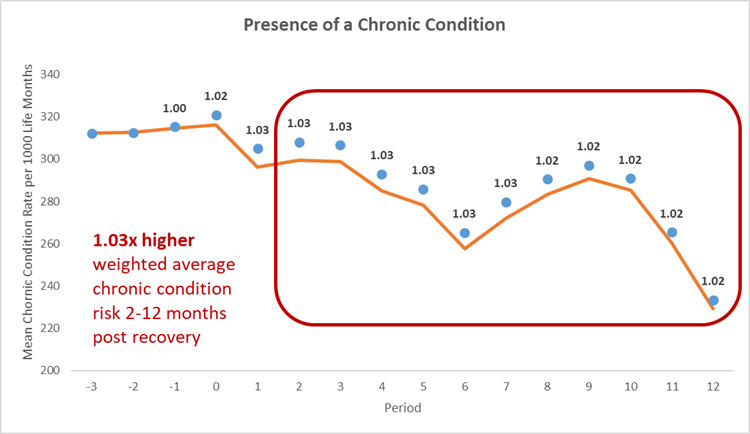
Figure 2: a) Chronic condition registration rate per 1,000 life months for the COVID-19 population and comparator population over time. Blue - mean of COVID-19 infected members. Orange - mean of uninfected individuals.
This excess utilization resulted in (Figure 2b)
- An average of 4.8 additional chronic registrations per 1,000 infections during the COVID-19 episode
- 9.0 additional chronic registrations per 1,000 life months one month post recovery
- A weighted average of 7.6 additional chronic registrations per 1,000 life months in each of the two to 12 months post recovery
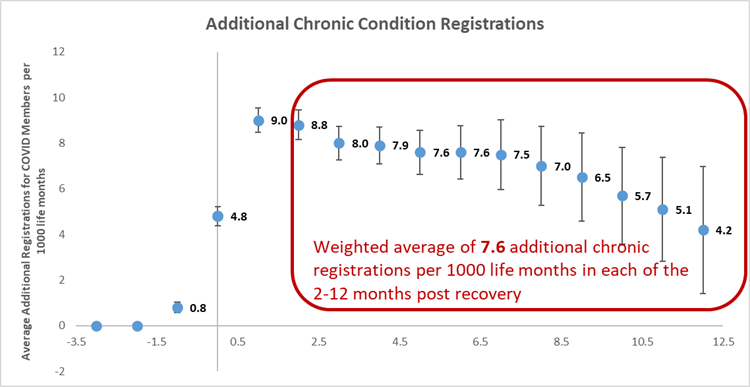
Figure 2: b) Average number of additional chronic condition registrations for COVID-19 members per 1,000 life months
b) Diabetes Mellitus (Type 1 And Type 2) And Essential Hypertension
In the case of diabetes (Figure 3a), we see:
- 50.4 registrations per 1,000 infections during the period of infection
- A 1.03 times higher risk one month post recovery
- A 1.08 times higher weighted average risk compared to matched clinical twins with no infection until month 12 after recovery
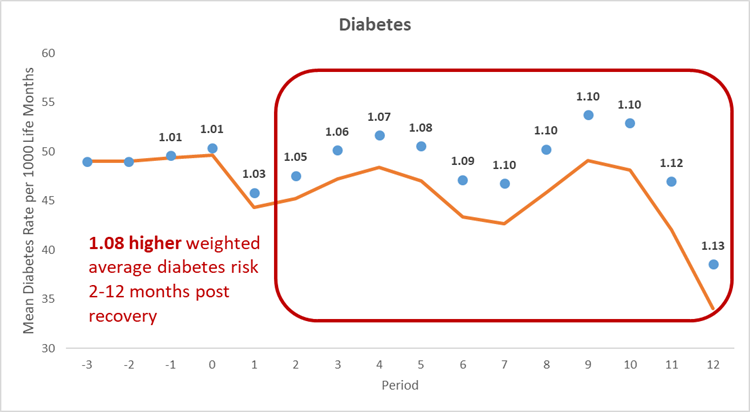
Figure 3: a) Diabetes registration rate per 1,000 life months for the COVID-19 population and comparator population over time. Blue - mean of COVID-19 infected members. Orange - mean of uninfected individuals.
This excess utilization resulted in (Figure 3b):
- An average of 0.7 additional registrations per 1,000 infections during the COVID-19 episode
- 1.5 additional registrations per 1,000 life months one month post recovery
- A weighted average of 3.4 additional registrations per 1,000 life months, for every month in the two to 12 months post recovery.
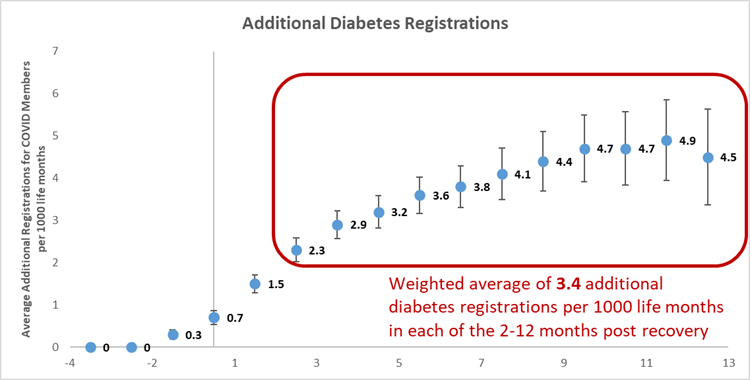
Figure 3: b) Average number of additional diabetes registrations for COVID-19 members per 1,000 life months
For hypertension (Figure 4a), we see:
- 160.6 registrations per 1,000 infections during the period of infection
- A 1.01 times higher risk one month post recovery
- A 1.03 times higher weighted average risk compared to matched clinical twins with no infection, until month 12 after recovery
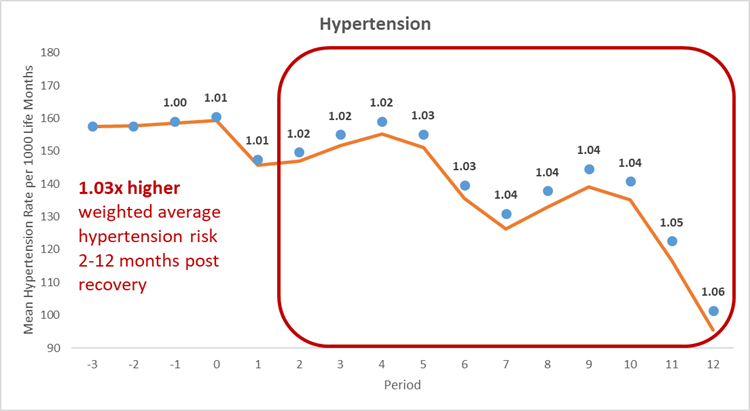
Figure 4: a) Essential hypertension registration rate per 1,000 life months for the COVID-19 population and comparator population over time. Blue - mean of COVID-19 infected members. Orange - mean of uninfected individuals.
This excess utilization resulted in (Figure 4b):
- An average of 1.2 additional hypertension registrations per 1,000 infections during the COVID-19 episode
- 1.9 additional registrations per 1,000 life months one month post recovery
- A weighted average of 4.0 additional registrations per 1,000 life months, for every month in the two to 12 months post-recovery.
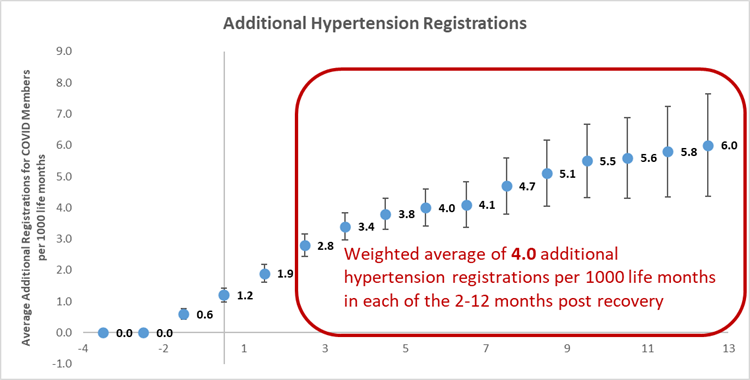
Figure 4: b) Average number of additional medical admissions for COVID-19 members per 1,000 life months
We conducted further analysis of clinical twins to extract insights into long-term chronic condition risk within various sub-cohorts of individuals.
What Chronic condition-related differences do we see in men and women?
In the infection period:
Compared to their clinical twins, men who got COVID-19:
- Experience both a higher relative (1.02 times higher) and excess chronic registration risk (six excess chronic registrations per 1,000 infections) than women.
- Have a higher absolute and excess number of registrations for both diabetes and hypertension.
Women have a greater absolute number of registrations (326 chronic registrations per 1,000 infections).
Compared to their clinical twins, both men and women have the same increased registration risk during the period of infection, at 1.01 times higher.
In the (post-infection) recovery period:
Both men and women experience a higher overall diabetes and hypertension risk for up to 12 months after recovery from COVID-19. Men experienced higher excess registrations than women, and higher absolute registrations for diabetes and hypertension.
Women experience a higher number of absolute registrations (302.7 chronic registrations per 1,000 infections) for 10 months after recovery from COVID-19.
|
Sex |
Period of Infection |
Post recovery |
|||||
|
|
Registration risk in Period of Infection |
Number of registrations per 1,000 infections during period of infection |
Number of excess registrations per 1,000 infections during period of infection |
Number of significant months (NSM-PR) post recovery |
Weighted average times higher registration risk until NSM-PR |
Weighted average number of registrations per 1,000 life months until NSM for COVID-19 population
|
Weighted average additional registrations per 1,000 life months in each of the NSM-PR |
|
Presence of a Chronic Condition |
|||||||
|
Female |
1.01 |
326.3 |
4.6 |
10 |
1.02 |
302.7 |
7.0 |
|
Male |
1.02 |
315.0 |
6.0 |
12 |
1.03 |
281.2 |
9.4 |
|
Diabetes |
|||||||
|
Female |
1.01 |
39.2 |
0.5 |
12 |
1.07 |
39.2 |
2.6 |
|
Male |
1.01 |
63.4 |
0.8 |
12 |
1.08 |
60.9 |
4.4 |
|
Hypertension |
|||||||
|
Female |
1.01 |
147.1 |
0.9 |
12 |
1.03 |
137.6 |
3.6 |
|
Male |
1.01 |
176.3 |
1.4 |
12 |
1.03 |
157.9 |
4.4 |
Table 2. Relative and absolute risks of Chronic Conditions for the COVID-19 population and comparator population over time by sex. Highlighted areas indicate the highest risk by sex.
What is the impact of age on chronic condition risk?
In the infection period:
- Younger members experience a higher overall registration risk compared to clinical twins: 1.29 times higher - highest overall - for 1 year old members
- Diabetes risk was highest in 5- to 11-year-old members - at 1.47 times higher than clinical twins
- Hypertension risk was highest for 19- to 39-year-old members - at 1.02 times higher than clinical twins.
In the (post-infection) recovery period
Generally:
Members aged 40 to 69 experience elevated overall chronic registration risk for the longest period of time - 12 months.
Members aged one to four also experience elevated risk for 12 months.
In terms of diabetes and hypertension:
- Members aged 50 to 59 experienced elevated risk for the longest time - 12 months.
- Younger members experience the highest relative risk (1.24 times higher weighted average chronic condition registration for members aged one to four, driven by asthma registrations - see table 4)
- We find a 1.59 times higher weighted average diabetes registration for members aged 5 to 11; and
- A 1.08 times higher weighted average hypertension risk for members aged 19 to 39.
Older members experienced the highest absolute number of registrations with a weighted average of:
- 866 chronic registrations per 1,000 life months for members aged 80+;
- 190 diabetes registrations per 1,000 life months for members aged 70-79
- 657 hypertension registrations per 1,000 life months for members aged 70-79.
Across all three registration types, members aged 50-59-year-old experience the greatest additional registrations per 1,000 life months.
|
Age |
Period of Infection |
Post recovery |
|||||
|
|
Registration risk in period of Infection |
Number of registrations per 1,000 infections during period of infection |
Number of excess registrations per 1,000 infections during period of infection |
Number of significant months (NSM-PR) post recovery |
Weighted average times higher registration risk until NSM-PR |
Weighted average number of registrations per 1,000 life months until NSM for COVID-19 population |
Weighted average additional registrations per 1,000 life months in each of the NSM-PR |
|
Presence of a Chronic Condition |
|||||||
|
< 1 |
1.29 |
8.1 |
0.9 |
- |
- |
- |
- |
|
1-4 |
1.06 |
57.0 |
3.2 |
12 |
1.24 |
63.9 |
12.1* |
|
5-11 |
1.03 |
126.3 |
3.3 |
8 |
1.05 |
117.2 |
5.2 |
|
12-18 |
1.01 |
150.2 |
1.4 |
5 |
1.03 |
141.0 |
3.5 |
|
19-39 |
1.03 |
165.0 |
4.2 |
8 |
1.04 |
157.5 |
5.9 |
|
40-49 |
1.02 |
331.8 |
6.4 |
12 |
1.04 |
330.7 |
11.4 |
|
50-59 |
1.02 |
500.3 |
7.8 |
12 |
1.03 |
490.6 |
14.1 |
|
60-69 |
1.01 |
692.9 |
7.4 |
12 |
1.02 |
663.6 |
12.9 |
|
70-79 |
1.01 |
830.2 |
7.5 |
10 |
1.02 |
787.2 |
12.9 |
|
80+ |
1.0 |
882.8 |
3.5 |
3 |
1.01 |
866.1 |
5.5 |
|
Diabetes |
|||||||
|
< 1 |
- |
- |
- |
- |
- |
- |
- |
|
1-4 |
0.81 |
0.2 |
0.2 |
- |
- |
- |
- |
|
5-11 |
1.47 |
1.4 |
0.4 |
5 |
1.59 |
1.8 |
0.6 |
|
12-18 |
1.01 |
2.7 |
0.0 |
2 |
1.1 |
2.9 |
0.3 |
|
19-39 |
1.04 |
8.5 |
0.3 |
12 |
1.22 |
10.2 |
1.8 |
|
40-49 |
1.02 |
45.7 |
0.8 |
12 |
1.1 |
53.2 |
4.7 |
|
50-59 |
1.02 |
103.2 |
1.8 |
12 |
1.08 |
116.4 |
8.3 |
|
60-69 |
1.01 |
166.4 |
1.5 |
11 |
1.04 |
171.4 |
6.5 |
|
70-79 |
1.0 |
200.7 |
0.7 |
8 |
1.03 |
189.7 |
4.6 |
|
80+ |
1.0 |
144.2 |
-0.5 |
- |
- |
- |
- |
|
Hypertension |
|||||||
|
< 1 |
- |
- |
- |
- |
- |
- |
- |
|
1-4 |
- |
- |
- |
- |
- |
- |
- |
|
5-11 |
0.98 |
0.1 |
-0.0 |
|
|
|
|
|
12-18 |
0.55 |
0.0 |
-0.0 |
- |
- |
- |
- |
|
19-39 |
1.02 |
28.8 |
0.7 |
12 |
1.08 |
30.8 |
2.4 |
|
40-49 |
1.01 |
147.0 |
1.6 |
12 |
1.04 |
152.1 |
5.9 |
|
50-59 |
1.01 |
301.9 |
2.1 |
12 |
1.03 |
311.6 |
9.0 |
|
60-69 |
1.0 |
495.8 |
1.4 |
11 |
1.01 |
494.9 |
5.7 |
|
70-79 |
1.0 |
657.3 |
2.5 |
10 |
1.01 |
657.4 |
8.5 |
|
80+ |
1.0 |
732.1 |
-0.0 |
- |
- |
- |
- |
Table 3. Relative and absolute risks of chronic conditions for the COVID-19 population and comparator population over time by age. Highlighted areas indicate the highest risk by age.
|
Age |
Period of Infection |
Post recovery |
|||||
|
|
Registration risk in period of Infection |
Number of registrations per 1,000 infections during period of infection |
Number of excess registrations per 1,000 infections during period of infection |
Number of significant months (NSM-PR) post recovery |
Weighted average times higher registration risk until NSM-PR |
Weighted average number of registrations per 1,000 life months until NSM for COVID-19 population |
Weighted average additional registrations per 1,000 life months in each of the NSM-PR |
|
Overall |
1.06 |
57.0 |
3.2 |
12 |
1.24 |
63.9 |
12.1 |
|
Asthma |
1.04 |
45.2 |
1.6 |
12 |
1.20 |
53.5 |
8.6 |
|
Bronchiectasis |
1.74 |
0.4 |
0.3 |
|
|
|
|
|
Cardiomyopathy |
0.49 |
0.1 |
-0.1 |
|
|
|
|
|
Congestive Cardiac Failure |
1.43 |
0.4 |
0.2 |
|
|
|
|
|
Depression |
1.03 |
0.6 |
-0.1 |
|
|
|
|
|
Diabetes Mellitus Type 1 |
0.79 |
0.2 |
0.2 |
|
|
|
|
|
Epilepsy |
1.06 |
3.9 |
0.1 |
|
|
|
|
|
HIV |
0.33 |
0.2 |
-0.5 |
|
|
|
|
|
Rheumatoid Arthritis |
1.22 |
0.3 |
0.3 |
|
|
|
|
|
Systemic Lupus Erythematosus |
0.62 |
0.1 |
0.1 |
|
|
|
|
Table 4: Increase in Chronic Registrations for medical scheme members aged one to four.
A deeper look at Chronic condition risk in child members
For medial scheme members aged 5 to 11, increased diabetes risk was driven by type 1 diabetes registrations. In this cohort (Figure 5), we see:
- 1.36 diabetes registrations per 1,000 infections during the period of infection
- A 1.70 times higher diabetes risk one month post recovery
- A 1.78 times higher weighted average diabetes risk compared to matched clinical twins with no infection until month five after recovery
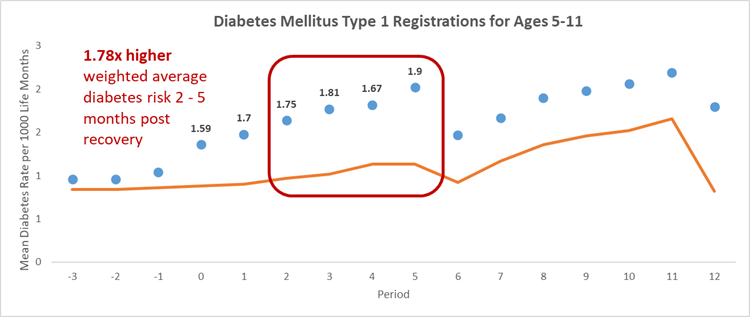
Figure 5a) Type 1 diabetes rate per 1,000 life months for COVID-19 population aged five to 11, and comparator population over time.
This excess utilization resulted in (Figure 5b)
- An average of 0.5 additional type 1 diabetes registrations per 1,000 infections during the COVID-19 episode
- 1.5 additional type 1 diabetes registrations per 1,000 life months one month post recovery
- A weighted average of 0.8 additional type 1 diabetes registrations per 1,000 life months, for every month in the 2-5 months post-recovery.
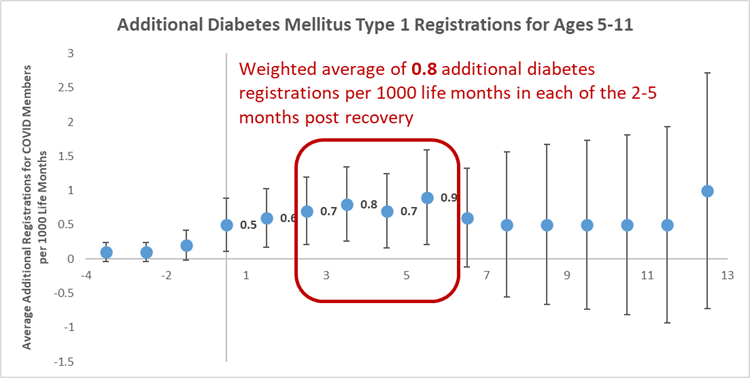
Figure 5b) Average number of type 1 diabetes registrations members aged five to 11 in the COVID-19 population, per 1,000 life months.
What is the impact of the COVID-19 variant contracted on chronic condition risk?
In the infection period:
Overall, members across all three of South Africa's COVID-19 waves (driven by three variants of concern - D614G, Beta and Delta respectively) experienced similar registration risk in the period of infection (1.01 to 1.02 times higher risk overall and also for diabetes and hypertension), while members who contracted the variant that drove the first wave (D614G variant) experienced higher absolute chronic registration risk.
In the (post-infection) recovery period:
There was an elevated risk of overall chronic registrations, as well as for diabetes and hypertension specifically across all three variants, for 10-12 months. Members who contracted the D614G variant experienced the greatest average number of registrations per 1,000 life months, as well as greatest weighted average excess registrations for diabetes and hypertension.
|
Circulating COVID-19 Variant
|
Period of Infection |
Post recovery
|
|||||
|
|
Registration risk in Period of Infection |
Number of registrations per 1,000 infections during period of infection |
Number of excess registrations per 1,000 infections during period of infection |
Number of significant months (NSM-PR) post recovery |
Weighted average times higher registration risk until NSM-PR |
Weighted average number of registrations per 1,000 life months until NSM for COVID-19 population |
Weighted average additional registrations per 1,000 life months in each of the NSM-PR |
|
Presence of a Chronic Condition |
|||||||
|
D614G |
1.01 |
330.3 |
4.7 |
12 |
1.03 |
324.4 |
8.4 |
|
Beta |
1.02 |
320.8 |
6.1 |
10 |
1.04 |
227.4 |
10.8 |
|
Delta |
1.02 |
329.4 |
6.5 |
12 |
1.06 |
288.3 |
15.5 |
|
Diabetes |
|||||||
|
D614G |
1.02 |
62.1 |
1.1 |
12 |
1.08 |
59.2 |
4.4 |
|
Beta |
1.01 |
52.6 |
0.7 |
12 |
1.11 |
39.1 |
3.2 |
|
Delta |
1.01 |
47.1 |
0.5 |
10 |
1.04 |
46.2 |
2.0 |
|
Hypertension |
|||||||
|
D614G |
1.01 |
169.4 |
1.8 |
12 |
1.03 |
160.8 |
5.0 |
|
Beta |
1.01 |
163.0 |
0.9 |
12 |
1.04 |
120.4 |
3.7 |
|
Delta |
1.01 |
160.8 |
0.9 |
12 |
1.02 |
158.3 |
2.9 |
Table 5. Relative and absolute risks of chronic conditions for the COVID-19 population and comparator population over time, by COVID-19 variant. Highlighted areas indicate the highest risk by COVID-19 variant.
What is the impact of vaccination status on chronic condition risk post COVID-19 infection?
In the infection period:
Overall, medical scheme who were members unvaccinated before getting COVID-19 experienced the highest increased relative registration risk during their acute infection. This observation was consistent for diabetes and hypertension, specifically.
Members fully vaccinated prior to their COVID-19 infection experienced no increased chronic registration risk both within and post their acute infection.
Fully vaccinated members had a greater absolute number of chronic registrations. This is likely related to the fact that members at higher risk for adverse outcomes from a COVID-19 infection (i.e., older members- and older members have a higher prevalence of chronic conditions) were more likely to get vaccinated compared to members without a chronic condition given South Africa's age-based COVID-19 vaccine rollout.
In the recovery (post-infection) period:
Fully vaccinated members experienced no increased chronic registration risk post recovery. For unvaccinated members, elevated risk was experienced for the full 12 months post recovery for overall chronic registration risk, as well as registrations for diabetes and hypertension, specifically.
|
Vaccination Status
|
Period of Infection |
Post recovery |
|||||
|
|
Registration risk in Period of Infection |
Number of registrations per 1,000 infections during period of infection |
Number of excess registrations per 1,000 infections during period of infection |
Number of significant months (NSM-PR) post recovery |
Weighted average times higher registration risk until NSM-PR |
Weighted average number of registrations per 1,000 life months until NSM for COVID-19 population |
Weighted average additional registrations per 1,000 life months in each of the NSM-PR |
|
Presence of a Chronic Condition |
|||||||
|
Unvaccinated |
1.02 |
306.4 |
4.9 |
12 |
1.03 |
282.9 |
7.7 |
|
Fully Vaccinated |
1.00 |
484.7 |
1.5 |
- |
- |
- |
- |
|
Diabetes |
|||||||
|
Unvaccinated |
1.02 |
47.1 |
0.7 |
12 |
1.08 |
46.4 |
3.5 |
|
Fully Vaccinated |
1.01 |
83.3 |
0.9 |
- |
- |
- |
- |
|
Hypertension |
|||||||
|
Unvaccinated |
1.01 |
148.8 |
1.2 |
12 |
1.03 |
135.7 |
4.1 |
|
Fully Vaccinated |
1.00 |
295.5 |
0.7 |
- |
- |
- |
- |
Table 6. Relative and absolute risks of chronic conditions for the COVID-19 population and comparator population over time by vaccination status. Highlighted areas indicate the highest risk by vaccination status.
Where people went to hospital when they got COVID-19, what was the impact of the type of ward or seriousness of admission on post-infection chronic registration risk?
In the infection period:
The absolute number of overall, diabetes and hypertension registrations is highest for higher acuity medical scheme members (those admitted to ICU or who required ventilation), and lowest for members who were not hospitalized during their COVID-19 infection.
In the (post-infection) recovery period:
Regardless of the acuity of their hospitalisation, higher registration risk is experienced for all members for up to 12 months post recovery.
Higher relative and absolute risk is experienced for higher acuity members (those who were admitted to ICU or ventilated).
The lowest relative and absolute overall, diabetes and hypertension risk are experienced by medical scheme members who were not hospitalized while infected with COVID-19.
|
Highest Acuity
|
Period of Infection |
Post recovery |
||||||
|
|
Registration risk in Period of Infection |
Number of registrations per 1,000 infections during period of infection |
Number of excess registrations per 1,000 infections during period of infection |
Number of significant months (NSM-PR) post recovery |
Weighted average times higher registration risk until NSM-PR |
Weighted average number of registrations per 1,000 life months until NSM for COVID-19 population |
Weighted average additional registrations per 1,000 life months in each of the NSM-PR |
|
|
Presence of a Chronic Condition |
||||||||
|
Hospitalized: Ventilation |
1.02 |
654.3 |
15.5 |
12 |
1.16 |
610.5 |
84.1 |
|
|
Hospitalized: ICU |
1.04 |
658.0 |
27.9 |
12 |
1.17 |
617.7 |
88.6 |
|
|
Hospitalized: High Care |
1.05 |
597.0 |
31.0 |
12 |
1.11 |
570.8 |
57.4 |
|
|
Hospitalized: General Ward |
1.04 |
498.0 |
19.2 |
12 |
1.07 |
450.3 |
30.5 |
|
|
Not hospitalized |
1.01 |
287.5 |
2.2 |
8 |
1.02 |
270.4 |
4.1 |
|
|
Diabetes |
||||||||
|
Hospitalized: Ventilation |
1.01 |
220.4 |
2.3 |
12 |
1.15 |
225.5 |
29.6 |
|
|
Hospitalized: ICU |
1.02 |
212.1 |
4.6 |
12 |
1.22 |
217.0 |
39.0 |
|
|
Hospitalized: High Care |
1.03 |
171.6 |
5.4 |
12 |
1.22 |
181.5 |
32.1 |
|
|
Hospitalized: General Ward |
1.03 |
112.2 |
3.3 |
12 |
1.14 |
114.7 |
13.7 |
|
|
Not hospitalized |
1.01 |
36.3 |
0.3 |
12 |
1.04 |
37.9 |
1.3 |
|
|
Hypertension |
||||||||
|
Hospitalized: Ventilation |
1.01 |
477.3 |
3.8 |
12 |
1.12 |
434.2 |
46.4 |
|
|
Hospitalized: ICU |
1.01 |
472.8 |
5.3 |
12 |
1.11 |
449.4 |
42.7 |
|
|
Hospitalized: High Care |
1.01 |
395.3 |
3.7 |
12 |
1.06 |
371.6 |
21.3 |
|
|
Hospitalized: General Ward |
1.01 |
307.3 |
2.7 |
12 |
1.04 |
275.1 |
10.1 |
|
|
Not hospitalized |
1.01 |
130.7 |
0.9 |
12 |
1.02 |
126.4 |
2.6 |
|
Table 7. Relative and absolute risks of chronic conditions for the admitted COVID-19 population and comparator population over time by highest admission acuity. Highlighted areas indicate the highest risk by highest acuity.
Conclusion
In this, the third of three post-COVID impact analyses we are publishing, we have considered the risk of developing a chronic condition (any condition, or diabetes or hypertension) for up to 12 months post a COVID-19 infection.
We have looked at this risk according to:
- Sex
- Age
- Likely COVID-19 variant contracted
- Vaccination status
- Where members went to hospital when they had COVID-19, at the seriousness of the admission and how this impacted long-term chronic registration risk.
We see that registration risk for any chronic condition, as well as for diabetes and hypertension specifically, persists for up to 12 months post recovery
There is significant variability in the duration of risk by:
- Age - The longest elevated risk for overall registration us seen in medical scheme members aged 40 to 69, and longest elevated risk for diabetes and hypertension is in medical scheme members aged 50-59.
- Vaccination status - Members fully vaccinated prior to COVID-19 infection experience no elevated risk of a chronic illness registration.
Furthermore:
- In terms of sex, vaccination status and highest acuity (seriousness of any hospital admission), post infection both relative and absolute risk is highest for males, members who are unvaccinated and those experience the highest acuity (admitted to ICU or ventilated) admissions to hospital.
- In terms of age, the highest relative risk is in younger members (ages one to four for overall risk; ages five to 11 for diabetes risk and 19 to 39 for hypertension risk), while the greatest excess registration risk (for all chronic conditions as well as diabetes or hypertension) is seen in members aged 50 to 59..
- Relative and absolute risk post COVID-19 infection also varies by likely COVID-19 variant.
This article concludes our three-part post-COVID series.
Evidence on the risk people face long-term post-COVID recovery continues to emerge on a local and global scale. The additional two articles in our three-part series will add to the picture we've begun to build on in this first article.
- Authors of this article note that the above findings are representative of our medical scheme member population mix, and the long-term patterns observed may be different in other populations and in different clinical settings. It is also important to note this data analysis considers claims data (i.e., claims submitted for members of medical schemes administered by Discovery Health).
Acknowledgements
We would like to thank Discovery Health's Business Intelligence and Big Data Administration teams for the data assets and substantial computational power made available to facilitate our work on this study, as well as Discovery Health's Clinical Coding Intelligence team.
References
- Graves JA, Baig K, Buntin M. The Financial Effects and Consequences of COVID-19: A Gathering Storm. JAMA. 2021;326(19):1909-1910. doi:10.1001/jama.2021.18863
- Bang JY, Hawes R, Varadarajulu S. Clinical, financial and academic implications of COVID-19 on a tertiary care interventional endoscopy programme. Gut 2021; 70:1431-1434.
- Kaye AD, Okeagu CN, Pham AD, et al. Economic impact of COVID-19 pandemic on healthcare facilities and systems: International perspectives. Best Pract Res Clin Anaesthesiol. 2021;35(3):293-306. doi: 10.1016/j.bpa.2020.11.009
- Yan Xie, Evan Xu, Benjamin Bowe and Ziyad Al-Aly Long-term cardiovascular outcomes of COVID-19. Nature Medicine volume 28, pages583-590 (2022).
Interested in knowing more or reporting on these findings?
Please contact us on MEDIA_RELATIONS_TEAM@discovery.co.za to request any updated data available since publication and any further context required.
Did you find this post useful?
Read our related posts, the first and second article in this three-part series in which we consider post-COVID risk of admission to hospital and of also of mortality - with analysis for three months prior to and up to 12 months post infection.
Also, read our related post (not part of this three-part Long COVID utilisation series) titled "Long COVID symptoms, impact on carrying out daily activities: Survey of just over 7,000 medical scheme members reveals key insights." We find that an alarmingly high number of medical scheme members have protracted COVID-19 symptoms (long COVID), often with disruption to daily living. The risk of these events is higher in women, in those admitted to hospital or ICU for COVID-19, and those with high morbidity and pre-existing chronic illness. Being COVID-19 vaccinated and regular physical activity lower this risk.
Disclaimer
All information shared on this page is based on perspectives gained from analysing data acquired by Discovery Ltd and its various affiliate entities (Discovery). The analysis, which is conducted by Discovery's actuarial and data science team, aims to encourage industry dialogue. Publications containing our analyses are shared for educational and informational purposes only. Each publication reflects only the data available for analysis at the time of publication. It does not, unless otherwise indicated, constitute peer-reviewed, published scientific research, and hence should not be interpreted as such or used as a basis for altering treatment decisions. While every effort has been made to ensure the accuracy of the content conveyed, we cannot be held liable or responsible for any actions or decisions taken based on the information shared in this article.

15 min read
Deep dive: Admission rates across South Africa's four COVID-19 waves confirm Omicron-driven fourth wave's lower severity, and more.
07 July 2022
Authors: Chana Suttner (Actuary, Discovery Health),Michael Cohen (Actuarial Analyst, Discovery Health), Shirley Collie (Chief Healthcare Analytics Actuary, Discovery Health

13 min read
Long COVID symptoms, impact on carrying out daily activities: Survey of just over 7,000 medical scheme members reveals key insights
16 June 2022
Authors: Shirley Collie (Chief Healthcare Analytics Actuary, Discovery Health), Lizelle Steenkamp (Senior Healthcare Statistician, Discovery Health), Lebohang Radebe (Data Scientist, Discovery Health), Dr Smybinn Mathews (Clinician, Discovery Health) and Dr Dave Jacobs (Senior Clinician and Clinical Classification System Architect, Discovery Health)

13 min read
Discovery's COVID-19 personal resilience index predicts an individual's resilience to serious COVID-19 illness
23 May 2022
Authors: Lizelle Steenkamp (Senior Healthcare Statistician at Discovery Health), Tommy Chen (Actuary at Discovery Health), Jared Champion (Senior Actuary at Discovery Health) and Donald Ntjana (Senior Data Scientist at Discovery Health)